Introduction
We are going to design a dynamic chart using the Graphics class built into the .NET framework. It will be a dynamic chart because the data will be passed to the chart through an external .ocx file. The chart will read the data in this external file, and then draw the chart according to the data it has been given.
Data Page
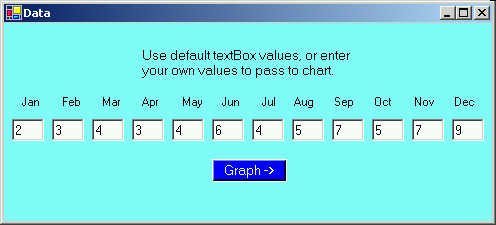
The data is entered on this page. I have entered default data so that you don't have to enter anything into the textboxes, however if you wish to enter data, then you can see how this dynamically affects the chart.
Chart

I have designed the chart to "autoscale". This means that the chart will determine the largest integer sent to it, and then adjust the scale on its "X" axis accordingly. We do this because we want the chart to fall within the limits of the scale. In other words we don't want the chart appear so small at the bottom that it cannot be interpreted properly, and we don't want the chart to overflow the limits of the scale. The maximum integer accepted by this chart is 1,000. We have scales of "0 - 10", "0 - 50", "0 - 100", "0 - 250", "0 - 500", and "0 - 1000". The "Y" axis of the chart is set to read the months of the year. We therefore need 12 rectangles, so that there will be a "bar" for each month.
I derived formulas for calculating the Y position of each scale. The bottom of the chart's Y value is 600, so the top of our rectangle will be a ratio determined by the scale subtracted from 600. For example, when our scale is "0 - 1000", the Y position of the top of our rectangle is determined by the formula:
Chart1 = 600 - (5 * Qso1)/ 10;
The X position of the rectangle is set according to the width of the chart, the number of months in a year (for this chart), and the width of each rectangle:
X Position =
  Bar Chart No * ((Chart Width)/(No of Rectangles) - (Rectangle Width)/2)
I sort the data passed to the chart, in ascending order, to determine what the largest value of data is that has been passed to the chart. After I call this sorting method, these values are reassigned to another array (int [] d ). The last integer in this array is the largest integer. Determining this largest integer is the only purpose of this array, and it does not affect how the data is drawn. This array only affects which scale is to be used.
The values that have been passed are assigned to a rectangle position on the screen, and the monthly figures are represented in the chart. This integer is drawn at the top of the bar to clarify its value.
Sample code
private void bttnStart_Click(object sender, System.EventArgs e)
{
StreamReader streamQso = new StreamReader( riteFileName );
readQso = streamQso.ReadToEnd();
streamQso.Close();
char[] trimChars = {'\u002c'};
passQso = Regex.Split( readQso, @",\s*");
Graphics graph = this.CreateGraphics();
SolidBrush brush = new SolidBrush(Color.Red);
FontStyle style3 = FontStyle.Regular;
Font arial3 = new Font( new FontFamily( "Arial" ), 12, style3 );
FontStyle style4 = FontStyle.Bold;
Font arial4 = new Font( new FontFamily( "Arial" ), 40, style4 );
this.Qso1 = Int32.Parse(passQso[0]);
this.Qso2 = Int32.Parse(passQso[1]);
this.Qso3 = Int32.Parse(passQso[2]);
this.Qso4 = Int32.Parse(passQso[3]);
this.Qso5 = Int32.Parse(passQso[4]);
this.Qso6 = Int32.Parse(passQso[5]);
this.Qso7 = Int32.Parse(passQso[6]);
this.Qso8 = Int32.Parse(passQso[7]);
this.Qso9 = Int32.Parse(passQso[8]);
this.Qso10 = Int32.Parse(passQso[9]);
this.Qso11 = Int32.Parse(passQso[10]);
this.Qso12 = Int32.Parse(passQso[11]);
int[] d = new int[]{Qso1,
Qso2,
Qso3,
Qso4,
Qso5,
Qso6,
Qso7,
Qso8,
Qso9,
Qso10,
Qso11,
Qso12};
BubbleSort( d );
hold = d[11];
if ( hold <= 10 )
{
Chart1 = 600 - (50 * Qso1);
Chart2 = 600 - (50* Qso2);
Chart3 = 600 - (50 * Qso3);
Chart4 = 600 - (50 * Qso4);
Chart5 = 600 - (50 * Qso5);
Chart6 = 600 - (50 * Qso6);
Chart7 = 600 - (50 * Qso7);
Chart8 = 600 - (50 * Qso8);
Chart9 = 600 - (50 * Qso9);
Chart10 = 600 - (50 * Qso10);
Chart11 = 600 - (50 * Qso11);
Chart12 = 600 - (50 * Qso12);
brush.Color = Color.Black;
graph.DrawString( "10", arial3, brush, 70, 90 );
graph.DrawString( "9", arial3, brush, 70, 140 );
graph.DrawString( "8", arial3, brush, 70, 190 );
graph.DrawString( "7", arial3, brush, 70, 240 );
graph.DrawString( "6", arial3, brush, 70, 290 );
graph.DrawString( "5", arial3, brush, 70, 340 );
graph.DrawString( "4", arial3, brush, 70, 390 );
graph.DrawString( "3", arial3, brush, 70, 440 );
graph.DrawString( "2", arial3, brush, 70, 490 );
graph.DrawString( "1", arial3, brush, 70, 540 );
graph.DrawString( "0", arial3, brush, 70, 590 );
DrawGraph(graph);
}
if( hold > 10 )
{
if(hold <= 50)
{
Chart1 = 600 - 10 * Qso1;
Chart2 = 600 - 10 * Qso2;
Chart3 = 600 - 10 * Qso3;
Chart4 = 600 - 10 * Qso4;
Chart5 = 600 - 10 * Qso5;
Chart6 = 600 - 10 * Qso6;
Chart7 = 600 - 10 * Qso7;
Chart8 = 600 - 10 * Qso8;
Chart9 = 600 - 10 * Qso9;
Chart10 = 600 - 10 * Qso10;
Chart11 = 600 - 10 * Qso11;
Chart12 = 600 - 10 * Qso12;
brush.Color = Color.Black;
graph.DrawString( "50", arial3, brush, 50, 90 );
graph.DrawString( "45", arial3, brush, 50, 140 );
graph.DrawString( "40", arial3, brush, 50, 190 );
graph.DrawString( "35", arial3, brush, 50, 240 );
graph.DrawString( "30", arial3, brush, 50, 290 );
graph.DrawString( "25", arial3, brush, 50, 340 );
graph.DrawString( "20", arial3, brush, 50, 390 );
graph.DrawString( "15", arial3, brush, 50, 440 );
graph.DrawString( "10", arial3, brush, 50, 490 );
graph.DrawString( "5", arial3, brush, 50, 540 );
graph.DrawString( "0", arial3, brush, 50, 590 );
DrawGraph(graph);
}
}
}
private void DrawGraph(Graphics graph)
{
graph = this.CreateGraphics();
SolidBrush brush = new SolidBrush( Color.Blue );
Rectangle rect1 = new Rectangle(100, Chart1, 50, (600 - Chart1));
graph.FillRectangle( brush, rect1);
FontStyle style3 = FontStyle.Regular;
Font arial3 = new Font( new FontFamily( "Arial" ), 12, style3 );
brush.Color = Color.Black;
graph.DrawString( Qso1.ToString(), arial3, brush, 112, (Chart1 - 20 ));
SolidBrush brush2 = new SolidBrush(Color.BlanchedAlmond);
Rectangle rect2 = new Rectangle( 170, Chart2, 50, (600 - Chart2));
graph.FillRectangle( brush2, rect2 );
brush.Color = Color.Black;
graph.DrawString( Qso2.ToString(), arial3, brush, 182, (Chart2 - 20 ));
SolidBrush brush3 = new SolidBrush(Color.ForestGreen);
Rectangle rect3 = new Rectangle( 240, Chart3, 50, (600 - Chart3));
graph.FillRectangle( brush3, rect3 );
brush.Color = Color.Black;
graph.DrawString( Qso3.ToString(), arial3, brush, 252, (Chart3 - 20 ));
SolidBrush brush4 = new SolidBrush(Color.Brown);
Rectangle rect4 = new Rectangle( 310, Chart4, 50, (600 - Chart4));
graph.FillRectangle( brush4, rect4 );
brush.Color = Color.Black;
graph.DrawString( Qso4.ToString(), arial3, brush, 322, (Chart4 - 20 ));
SolidBrush brush5 = new SolidBrush(Color.DarkMagenta);
Rectangle rect5 = new Rectangle( 380, Chart5, 50, (600 - Chart5));
graph.FillRectangle( brush5, rect5 );
brush.Color = Color.Black;
graph.DrawString( Qso5.ToString(), arial3, brush, 392, (Chart5 - 20 ));
SolidBrush brush6 = new SolidBrush(Color.BlanchedAlmond);
Rectangle rect6 = new Rectangle( 450, Chart6, 50, (600 - Chart6));
graph.FillRectangle( brush6, rect6 );
brush.Color = Color.Black;
graph.DrawString( Qso6.ToString(), arial3, brush, 462, (Chart6 - 20 ));
SolidBrush brush7 = new SolidBrush(Color.DarkGreen);
Rectangle rect7 = new Rectangle ( 520, Chart7, 50, (600 - Chart7));
graph.FillRectangle( brush7, rect7 );
brush.Color = Color.Black;
graph.DrawString( Qso7.ToString(), arial3, brush, 532, (Chart7 - 20 ));
SolidBrush brush8 = new SolidBrush(Color.Gold);
Rectangle rect8 = new Rectangle ( 590, Chart8, 50, (600 - Chart8));
graph.FillRectangle( brush8, rect8 );
brush.Color = Color.Black;
graph.DrawString( Qso8.ToString(), arial3, brush, 602, (Chart8 - 20 ));
SolidBrush brush9 = new SolidBrush(Color.BlueViolet);
Rectangle rect9 = new Rectangle( 660, Chart9, 50, (600 - Chart9));
graph.FillRectangle( brush9, rect9 );
brush.Color = Color.Black;
graph.DrawString( Qso9.ToString(), arial3, brush, 672, (Chart9 - 20 ));
SolidBrush brush10 = new SolidBrush(Color.Firebrick);
Rectangle rect10 = new Rectangle( 730, Chart10, 50, (600 - Chart10 ));
graph.FillRectangle( brush10, rect10 );
brush.Color = Color.Black;
graph.DrawString( Qso10.ToString(), arial3, brush, 742, (Chart10 - 20 ));
SolidBrush brush11 = new SolidBrush(Color.BlanchedAlmond);
Rectangle rect11 = new Rectangle( 800, Chart11, 50, (600 - Chart11));
graph.FillRectangle( brush11, rect11 );
brush.Color = Color.Black;
graph.DrawString( Qso11.ToString(), arial3, brush, 812, (Chart11 - 20 ));
SolidBrush brush12 = new SolidBrush(Color.DarkOrange);
Rectangle rect12 = new Rectangle( 870, Chart12, 50, (600 - Chart12));
graph.FillRectangle( brush12, rect12 );
brush.Color = Color.Black;
graph.DrawString( Qso12.ToString(), arial3, brush, 882, (Chart12 - 20 ));
}
Printing this chart
I like to print this chart using Print Scrn. Follow the instructions for Print Scrn function from your computer manufacturer, and use the imaging tool that is supplied to you by that manufacturer. This image ( .jpg, .png) can be resized and cropped accordingly. You can e-mail these files, or print them, and include them in your report. This is a great addition to your presentation layer.
Summary
This simple auto scaling chart is a useful tool in your project. It adds color and gives your program some eye appeal. Have fun with the Graphics in C#. Build your own chart to suit your own needs, and tastes.
I studied Fortran IV in HighSchool where we had 2 keypunch machines, and access to an IBM 1100 at the Community College. We ran our programs batch, and compiled our programs on paper tape.
Years later when PC's became affordable, I gave programming another shot. This time I studied RPG with the IBM AS-400 computer. I could access the College Computer with Emulator Software( Mocha Soft MW 5250 ) and my home PC.
C++ came later, then VB-6, C#.Net, and Managed C++. I am currently studying VB.Net


 General
  News
News  Suggestion
  Question
  Bug
Bug  Answer
  Joke
Joke  Praise
  Rant
Rant  Admin
Admin 


