Introduction
In this article, I will discuss how to utilise deterministic destruction in C++ in order to create a simple debug log. The purpose of this log will be to show the flow of execution and the values of variables.
Update: This is the third version of this article. The article itself is unchanged, but the source project had some errors in its Release version (as pointed out by bilo81, thanks for that). These have now been fixed.
Before anyone goes off on a rant about how this is not a proper logging framework and how it is not supporting the most commonly found features of other logging frameworks such as log levels and multiple log destinations, let me reiterate that this is a simple debug log. The intention of this article is to describe a light-weight log utility used to provide information useful for debugging, not for application state logging. For an awesome full-fledged logging framework for C++, I'd suggest you check out this.
Background
In some utilities and console applications I've had to write, I've found myself sometimes running into issues only on a specific platform or under a certain configuration. In these cases, I've often not have had access to a debugger that I can attach to the process, and debugging and troubleshooting have therefore been difficult as just outputting the error does not provide enough information to fully diagnose the issue.
In these cases, I have resorted to using a utility similar to the one this article will discuss, something that can track a few vital things that enables me to pinpoint the problem and provide me with enough context to figure out what's wrong. The things I like to track are:
- Method entry
- Method exit
- Call chain
- Variable values
- Exceptions thrown
By using some macros, these things can be outputted in a neat format, providing call chain context by indenting the output as the call stack gets deeper.
Using the code
As this is supposed to be something light-weight, the intention is to include the files DebugLog.hpp and DebugLog.cpp directly into the project you want to add debug logging to, rather than linking against a library.
Implementation
Overview
In order to enable and disable the logging using a pre-processor directive, macros are used for all logging statements. Normally, I'm not a big fan of macros because most of the macros I've seen, I believe, should have been implemented as methods instead, but in this case, they're not only a necessity, they also provide some neat functionality such as enabling the debug log to output the name of a variable.
Method entry and exit
In order to log method entry and exit, something has to be written to the log whenever a method is entered or exited. To log something on entry is easy, simply call the the appropriate log method as the very first thing of every method:
void foo()
{
  DEBUG_METHOD("foo");
}
Or, for class methods:
void myclass::foo()
{
  DEBUG_METHOD("myclass::foo");
}
Assuming that DEBUG_METHOD is a macro that somehow outputs an appropriate log string, for example:
#define DEBUG_METHOD(name) std::cout << "-->" << name;
Using the __FUNCTION__ macro
After the update to this article on 2010-03-08, I've added another version of the source project for download. The new version uses a parameter-less version of DEBUG_METHOD, and instead of having the programmer type in the function name (in some cases, complete with the class name as well), it uses a macro provided by the compiler called __FUNCTION__. This is a nifty macro that the compiler keeps updating during compilation so that it always gives the name of the function or class method it is used in. And, thanks to the way C++'s pre-processor resolves macros, it is possible to use a macro within a macro. Neat! At this point, I have to send my thanks to bling who pointed this out to me; thanks man!
(Now, back to the original article text).
To log the method exit might initially seem slightly harder, as a method can exit in several places and in several different ways (it can return or throw an exception). One would not want to add a DEBUG_METHOD_EXIT macro to all places where the method can return, both because it would clutter the code and be tedious to maintain, but because of exceptions, it's impossible to cover all exits.
But if DEBUG_METHOD instead of simply outputting a message also creates an object on the stack, then the deterministic destruction of objects in C++ will guarantee its destructor to be called whenever the scope of that object completes, be it by return or by an exception being thrown. So, by changing the initial macro definition to:
#define DEBUG_METHOD(name) bornander::debug::log _debugLog(name);
this becomes possible. In this case, bornander::debug is the namespace containing the class called log, which is instantiated with _debugLog as a variable name, passing in the method name to its constructor. When the _debugLog object's scope completes, the destructor is called, and it's therefore possible to log both entry and exit using a singe log statement.
The constructor and destructor of the log class look something like (assuming that the method name is stored in a class member called context):
log::log(const std::string& ctx) : context(ctx)
{
  std::cout << "-->" << context << std::endl;
}

log::~log()
{
  std::cout << "<-- " << context << std::endl;
}
This would produce an output (when calling a method called main) that looks like this:

This is all well and good, but in order to show the call chain (or stack depth), this method lacks formatting, as shown below, where main calls foo, which in turns calls bar:
While it is still possible to deduce the call chain, the output formatting doesn't go to any great lengths to make it easy for the user to do so. This can be solved by letting the log class store a static integer holding the stack depth. By converting the stack depth to an indentation, the output can be formatted to show the call chain. Since it is stored in a static member, each instance of the log class simply increments it in its constructor, and decrements it in its destructor. Using this technique, the output becomes more readable:
The logging statements required to get the output above would be something like this:
int bar()
{
DEBUG_METHOD("bar");
return 1;
}
void foo()
{
DEBUG_METHOD("foo");
switch(bar())
{
case 0:
return;
case 1:
break;
default:
throw std::exception("failed");
}
}
int main(int , char** )
{
DEBUG_METHOD("main");
foo();
return 0;
}
Notice that regardless of how or where the foo method exists, the log output is the same as the exit output is written on scope completion of the log object instantiated at the top of every method using the DEBUG_METHOD macro.
Execution time
In this debug log, it is also possible to get the method exit output to include the execution time of the logged method (including any of its children). This is done by storing the current time when the log object is instantiated, and then subtracting this from the time of destruction. There are many ways to get a timestamp in C++. I decided to go with the clock() method found in time.h. As including that particular header might not be part of the logged application, it is possible to disable the timing completely, or rather, it has to be explicitly enabled by defining DEBUG_LOG_ENABLE_TIMING.
This yields a constructor/destructor pair for the log class that looks like this:
int log::indentation = 0;
std::ostream* log::stream = &&std::cout;

log::log(const std::string& ctx)
: context(ctx)
#ifdef DEBUG_LOG_ENABLE_TIMING
    , start_time(clock())
#endif
{
    write_indentation();
    *stream << "--> " << context << std::endl;
    ++indentation;
}

log::~log()
{
    --indentation;
    write_indentation(std::uncaught_exception() ? '*' : ' ');
    *stream << "<-- " << context;
#ifdef DEBUG_LOG_ENABLE_TIMING
    *stream << " in " << ((double)(clock() - start_time) / CLOCKS_PER_SEC) << "s";
#endif
*stream << std::endl;
}
The std::ostream* log::stream is another static member holding a reference to the output method, by default set to std::cout. Indentation by stack depth is written using the private helper method write_indentation(), which simply uses the value stored in the static indentation variable to write a couple of spaces to log::stream.
Exception logging
When an exception is thrown, it's good to know how it bubbles up the call stack, especially if it is one that is not going to be caught at all by the application (in the case, of an unexpected exception). A neat function included in STL is std::uncaught_exception(), which returns true if there's currently an uncaught exception alive. In the destructor of the log class, this is called to use an asterisk to indicate that the current method exited because of an exception (as shown in the code example above).
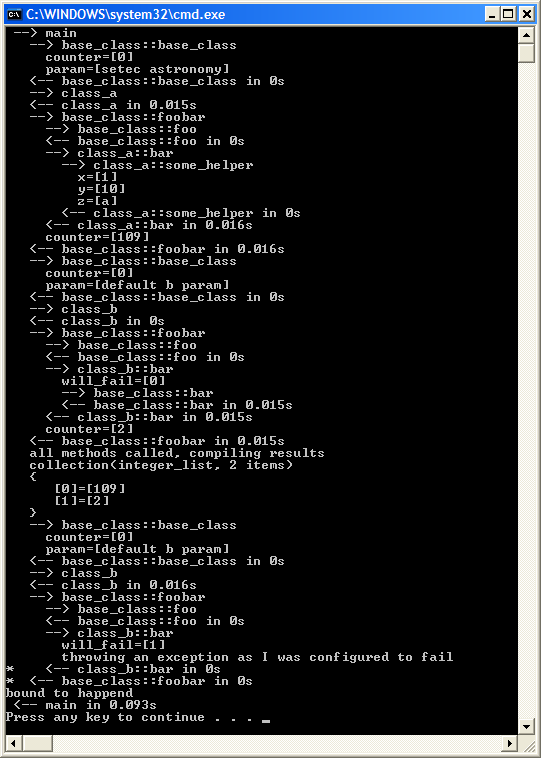
So, in the previous application example, if the bar() method had returned 2 for example, then the output would have looked like this instead (provided that the exception was caught and handled in the main method):
The * character is, in this example, indicating that when the foo() method completed, there was a live exception still uncaught, but as the main() method exit log is not preceded by a *, that exception must have been caught in that method.
Logging value of variables
To get enough information to troubleshoot an issue, both the context (call chain) and the values of the relevant variables need to be logged. Preferably, the logger should be able to log any type of value. To achieve this in a .NET language would have been easy since all objects inherit from System.Object and a textual representation of the value can be retrieved using the ToString() method. C++ does not offer such luxuries, but by using template programming, it is possible to achieve something similar. But the logging value alone is not enough. The value has to have the name as well, and this could have been done by something like:
#define LOG_VARIABLE(name, value) log_variable(name, value);

template<T> void log_variable(const std::string& name, const T& value)
{
  std::cout << name << "=" << value << std::endl;
}
The annoying thing about this is that the programmer is forced to manually name the value when outputting it, which is redundant in most cases since the identifier being logged usually has a name anyway (the name of the variable). To get around this problem, I used the # operator of C++'s pre-processor language, which will yield the name, rather than the value, of a passed parameter:
#define DEBUG_VALUE_OF(variable) { _debugLog.value_of(#variable, variable, false); }

class log
{
  template<class T> void value_of(const std::string& name,
             const T& value, const bool outputTypeInformation);
};

template<class T> void log::value_of(const std::string& name,
              const T& value, const bool outputTypeInformation)
{
  write_indentation();

  *stream << name;
#ifdef DEBUG_LOG_ENABLE_TYPE_OUTPUT
  if (outputTypeInformation)
  {
    *stream << "(" << typeid(value).name() << ")";
  }
#endif
  *stream << "=[" << value << "]" << std::endl;
  stream->flush();
}
This allows the programmer to log variables and their values using this syntax:
std::string str = "Hello, world!";
DEBUG_VALUE_OF(str);
And, the output would be (provided support for RTTI was not enabled):
name=[Hello, world!]
The DEBUG_LOG_ENABLE_TYPE_OUTPUT define is to enable/disable outputting of run time type information. This is useful when debugging applications that dynamically instanciate different objects inheriting from a base class, as it allows the logger not to output just the variable, but also the type of it. In most cases, this is not important, and the complex types of C++ makes this a bit messy (always printing the full type information for a simple string is really annoying). Because of this, this simple debug log comes with different macros for debugging variables so that that technique can be used only when necessary.
Collections
By relying on the duck-typing of C++ templates, the values in some collections can also be debugged. In my implementation, this relies on the collection at hand, having things such as size_type and size() defined on them. There are also macros provided to not output all elements in the collection. In case the collection is big, the programmer can say, "I only want to see the top or bottom 8", for example. The macros for the collection value logging looks like this:
#define DEBUG_VALUE_OF_COLLECTION(variable)
   { _debugLog.value_of_collection(#variable, variable, 0, all, false); }
#define DEBUG_VALUE_OF_TOP_COLLECTION(variable, maxCount)
   { _debugLog.value_of_collection(#variable, variable, maxCount, top, false); }
#define DEBUG_VALUE_OF_BOTTOM_COLLECTION(variable, maxCount)
   { _debugLog.value_of_collection(#variable, variable, maxCount, bottom, false); }
#define DEBUG_VALUE_AND_TYPE_OF_COLLECTION(variable)
   { _debugLog.value_of_collection(#variable, variable, 0, all, true); }
#define DEBUG_VALUE_AND_TYPE_OF_TOP_COLLECTION(variable, maxCount)
   { _debugLog.value_of_collection(#variable, variable, maxCount, top, true); }
#define DEBUG_VALUE_AND_TYPE_OF_BOTTOM_COLLECTION(variable, maxCount)
   { _debugLog.value_of_collection(#variable, variable, maxCount, bottom, true); }
In these macros, the all, top, and bottom identifiers are part of an enum used internally by the log class to determine which part of the collection to log. Again, template programming has to be used not only for the duck typing, but like in the case of normal variables, we need to deduce the argument type at compile time. Because of this, the log collection value method looks like this:
template<class T> void log::value_of_collection(
    const std::string& name,
    const T& collection,
    const typename T::size_type max,
    const list_segment segment,
    const bool outputTypeInformation)
{
  const T::size_type limit = max != 0 ?
    std::min<T::size_type>(max, collection.size()) : collection.size();

  T::size_type startIndex = 0;
  switch(segment)
  {
  case all:
  case top:
    startIndex = 0;
    break;
  case bottom:
    startIndex = collection.size() - limit;
    break;
  }

  const T::size_type endIndex = startIndex + limit;

  write_indentation();
  *stream << "collection(" << name;
  #ifdef DEBUG_LOG_ENABLE_TYPE_OUTPUT
  if (outputTypeInformation)
  {
    *stream << "(" << typeid(collection).name() << ")";
  }
  #endif
  *stream << ", " << collection.size()
          << " items)" << std::endl;
  write_indentation();
  *stream << "{" << std::endl;

  if (startIndex != 0)
  {
    write_indentation();
    *stream << "   ..." << std::endl;
  }

  for(T::size_type i = startIndex; i < endIndex; ++i)
  {
    write_indentation();
    *stream << "   [" << i << "]=["
            << collection[i] << "]" << std::endl;
  }

  if (endIndex != collection.size())
  {
    write_indentation();
    *stream << "   ..." << std::endl;
  }

  write_indentation();
  *stream << "}" << std::endl;
  stream->flush();
}
Enabling it all
So that it is possible to disable all logging, without rewriting anything, all logging is handled by macros. There are three that turn on/off the features of this logger:
DEBUG_LOG_ENABLEDEBUG_LOG_ENABLE_TIMINGDEBUG_LOG_ENABLE_TYPE_OUTPUT
The first one is the master-switch for the entire thing, the other two enable the timing of methods and the outputting of type information, respectively. To configure these at project level in Visual Studio, right-click the project and click Properties, Configuration Properties, C/C++, Preprocessor, and Preprocessor directives and simply add these three lines.
Points of interest
In order to successfully log stuff using the left-shift operator on a std::ostream, the logged artifact must support that operator. The primitives and std::string already do, but for custom objects, a friend method has to be declared. This is dead simple, and is explained in detail in parashift's C++ FAQ, chapter 15.8. There's also an example included in the test program in the source code for this article.
To set a different std::ostream than std::cout, simply use the macro DEBUG_SET_STREAM at the beginning of your main method.
DEBUG_SET_STREAM(std::cerr);
Again, this is not an attempt at creating an application log framework, this is something to help in debugging/trouble shooting applications in situations where attaching a debugger might be difficult, and as such, I think it works pretty well, except for performance (it's a bit too slow for my liking).
As always, any comments on the code or the article are most welcome.
History
- 2010-03-06: First version.
- 2010-03-08: Added version with the
__FUNCTION__ macro. - 2010-03-15: Fixed the compilation errors in the Release version.


 General
  News
News  Suggestion
  Question
  Bug
Bug  Answer
  Joke
Joke  Praise
  Rant
Rant  Admin
Admin 


 )
)