Introduction
Most of us (developers) use the “Generate Excel” feature in our applications. This allows us to generate an Excel copy on any of our reports. Most of us are also familiar with “Pivot Table” and “Pivot Charts”. This feature from MS Excel allows the end-user to formulize and visualize by experimenting and observing the output by changing the inputs (from the available set). This functionality can be easily implemented in ASP.NET by using the “Interop.Excel” DLL. However, to use the DLL, you need to have “MS Office” on the serve. What if “MS Office” is not installed on the server? Or if the server is a shared server with multiple applications residing on it? Installing “MS Office” may not be feasible. In such scenarios, generating the Pivot Tables and Pivot Charts on the client side seems to be a better approach. This approach won’t be just a performance booster as Excel and Pivot Table is generated on the client but can be easily implemented as well.
Background
This article describes how to generate Excel with the Pivot Table and Charts on the client-side.
Using the code
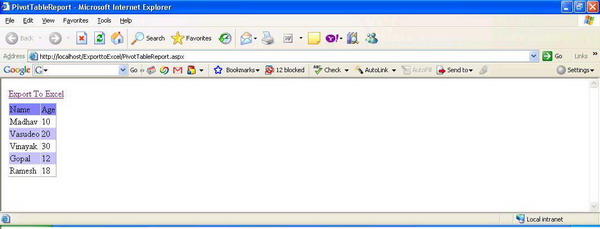
Displaying the report in the DataGrid
We first need to display the content of the data into a report. For this, we would need to just add the DataGrid to the web-page and bind the data from (DataTable) to the DataGrid. After this, we need to save the entire content of the data into a “Javascript Array” so that the entire data can be picked up and operated on the client side. Also, it would be advisable to save the row count and column count in hidden variables. Please note that we need not always save the column name in a hidden variable, but when I had coded, I had used the same page to generate the Excel for about fourteen reports along with Pivot Tables and Pivot Charts. You can easily remove the code for the column name and hard-code it. Also, we need to save the Heading and Orientation for the same in the hidden variable; we’ll see the details of the same in the later sections.
Dim strBldrForPivot As New StringBuilder("<script_ language="JavaScript">" & _
vbCrLf & "var PivotList = new Array(" & tempTable.Rows.Count & ");" & vbCrLf)
Dim jobRow As DataRow
Dim jobCol As DataColumn
Dim iCnt = 0
Dim iCol = 0
For Each jobRow In tempTable.Rows
iCol = 0
strBldrForPivot.Append("PivotList[" & iCnt & "] = _
new Array(" & tempTable.Columns.Count & ");" & vbCrLf)
For Each jobCol In tempTable.Columns
If jobRow.Item(iCol) Is DBNull.Value Or _
jobRow.Item(iCol) Is Nothing Then
strBldrForPivot.Append("PivotList[" & iCnt & "][" & _
iCol & "]= """ & " " & """;" & vbCrLf)
ElseIf jobRow.Item(iCol).GetType Is GetType(String) Then
If jobRow.Item(iCol) = "" Then
strBldrForPivot.Append("PivotList[" & iCnt & "][" & _
iCol & "]= """ & " " & """;" & vbCrLf)
Else
strBldrForPivot.Append("PivotList["& iCnt & "][" & iCol & "] = _
""" & CType(jobRow.Item(iCol),String).Trim & """;" & vbCrLf)
End If
Else
strBldrForPivot.Append("PivotList[" & iCnt & "][" & _
iCol & "] = """ & CType(jobRow.Item(iCol), String).Trim & """;" & vbCrLf)
End If
iCol += 1
Next
iCnt += 1
Next
strBldrForPivot.Append("</script>")
Page.RegisterStartupScript("PivotListing", strBldrForPivot.ToString)
The data is bound to the DataGrid as shown below:
Dim tempTable As DataTable
tempTable = GetDataTable()
DataGrid1.DataSource = tempTable
DataGrid1.DataBind()
The row count, column count, and headings and orientation are assigned to the hidden variables as shown below:
hdnRowCount.Value = tempTable.Rows.Count.ToString
hdnColCount.Value = tempTable.Columns.Count.ToString
For iCount As Integer = 0 To tempTable.Rows.Count
     If iCount = 0 Then
        hndName1.Value = "Name"
        hndName2.Value = "Age"
     Else
        hndName1.Value = hndName1.Value +
       "$" + CStr(tempTable.Rows(iCount -1).Item("Name"))
        hndName2.Value = hndName2.Value +
       "$" + CStr(tempTable.Rows(iCount - 1).Item("Age"))
     End If
Next
In the above piece of code, I have hard-coded the values, but in the project, I have picked those values from the stored-proc; this not only gave the application the freedom on just one place change, but also makes the application maintainable. You would notice a function “GetDataTable” being called, this function is used to pass data, and we can call a stored-proc in this function. Here, I am assigning sample data in the same:
Private Function GetDataTable() As DataTable
    Dim dt = New DataTable
    dt.Columns.Add("Name", Type.GetType("System.String"))
    dt.Columns.Add("Age", Type.GetType("System.Int16"))

    Dim dr As DataRow

    dr = dt.NewRow()
    dr("Name") = "Madhav"
    dr("Age") = 10
    dt.Rows.Add(dr)

    dr = dt.NewRow()
    dr("Name") = "Vasudeo"
    dr("Age") = 20
    dt.Rows.Add(dr)

    dr = dt.NewRow()
    dr("Name") = "Vinayak"
    dr("Age") = 30
    dt.Rows.Add(dr)

    dr = dt.NewRow()
    dr("Name") = "Gopal"
    dr("Age") = 12
    dt.Rows.Add(dr)

    dr = dt.NewRow()
    dr("Name") = "Ramesh"
    dr("Age") = 18
    dt.Rows.Add(dr)

    Return dt

End Function
Generating Excel sheet on the client-side
We need to create an instance of Excel using “ActiveX” at the client side and then assign the source and the destination sheet. The source sheet is the temporary sheet where we populate the data, and generate the “Pivot Table” in the second sheet or the destination sheet by providing the reference of the source sheet.
var ExlApp = new ActiveXObject("Excel.Application");
ExlApp.Visible = false;
ExlApp.DisplayAlerts = false;

var WorkBook = ExlApp.Workbooks.Add();
var Sheet = WorkBook.ActiveSheet;
var Sheet2 = WorkBook.Worksheets(2);
After doing this, we would copy the entire data to the temporary sheet or the source sheet as shown below:
for(j=0; j < parseInt(colCount);j++)
{
  for(i=0; i < parseInt(rowCount) + 1; i++)
  {
     letterCount =  CharIndex + parseInt(i + 1);
     if(i == 0)
     {
        Sheet.Range(letterCount).Value = arrHead[j];
     }
     else
     {
        Sheet.Range(letterCount).Value = PivotList[i - 1][j];
     }
  }
  CharIndex = incrementAlphabet(CharIndex);
}
The function “incrementAlphabet” just increments the alphabets starting from “A” for the columns in the Excel. The function is as follows:
function incrementAlphabet(alphaIncrement)
{
 indexOfLetter = alphabets.search(alphaIncrement);
 if (indexOfLetter+1 < alphabets.length)
 {
   return(alphabets.charAt(indexOfLetter+1));
 }
 else
 {
   return(alphaIncrement);
 }
}
A simpler approach to it is to just copy the “InnerHTML” of the DataGrid and to paste it in the source sheet. It can be done as shown below:
var objToExport = document.getElementById('DataGrid1');
var sourceHTML = objToExport.outerHTML;
WorkBook.HTMLProject.HTMLProjectItems("Sheet2").Text = sHTML;
Generating the Pivot Cache and creating the Pivot Table
Once the entire data has been copied to the source sheet, we need to cache the it to the “Pivot Cache” to generate the “Pivot Table”. Once the data is cached, we can create Pivot Tables. After we create “Pivot Tables”, we would assign the “Headers” and their respective orientations to the “Pivot Table”. The orientations of the “Headers” are like “Row Field”, “Data Field”, “Column Field”, “Page Field”, or “Hidden Field”.
var ptr = WorkBook.PivotCaches()
var pc = ptr.Add(1, "Sheet1!R1C1:R" + rowCountTemp+ "C" + colCount)
pc.CreatePivotTable("Sheet2!R1C1", "PivotTable1");

with(WorkBook.Worksheets(2).PivotTables("PivotTable1"))
{
    for(i=0; i< parseInt(colCount);i++)
    {
        with(PivotFields(arrHead[i]))
        {
            Orientation = arrOrnt[i];
            Name=arrHead[i];
            a = Name;
            tempString = Name;
        }
    }
}
We have the following values for Orientation:
- Hidden – 0
- Row Field – 1
- Column Field – 2
- Page Field - 3
- Data Field – 4
Inside the data field, we can assign various functions like “Sum”, “Average”, “Min”, “Maximun” etc. “Sum” is the default function and “Count” has value as – 4112. The best way to explore the same is to create a macro and put a break-point and try out various combinations in the immediate window.
Generating charts
After the “Pivot Table” has been generated, we need to provide the reference to the “Chart Objects” of the “Pivot Table” so that both the “Table” and “Chart” would be in synch. We also provide the other dimensions along with the data source to the chart objects, as shown below.
var rang = Sheet.Range("A1:C" + rowCount);
var rang2 = Sheet2.Range("A1:C" + rowCount);
var ch1 = Sheet2.ChartObjects.Add(rang2.Left + rang2.Width, rang2.Top, 350, 220);
ch1.Chart.ChartType = -4120;
ch1.Chart.SetSourceData(rang2, 2);

Deleting the source sheet and releasing the Excel object
Once the “Pivot Table” and “Charts” are created, we need to delete the source sheet. Also, the “Excel Object” needs to be made visible and editable for the user. We also need to populate the “Pivot Table” with all the items and make it available for the end user, this would be the last step of the program.
WorkBook.Worksheets(2).Name = _
  "Pivot_Table_Report"; WorkBook.Worksheets(1).Delete();
WorkBook.Worksheets(2).Delete();
WorkBook.HTMLProject.RefreshDocument();
ExlApp.UserControl = false;
ExlApp.Visible = true;
We populate the “Pivot Table” with all the items using the following command:
WorkBook.Worksheets(2).PivotTables("PivotTable1").DisplayImmediateItems = true;
Note that in “MS Office 2007”, the following line may throw an error, hence we need to add that line in a try – catch block, in case a few end-users may have “MS Office 2007”.
WorkBook.HTMLProject.RefreshDocument();
High-lighting the Headings
There are quite a few approaches to highlight the "Headings", but I chose a simpler one. Here, we just search for the "Text"/"Header" in the spread-sheet and change the background and foreground color of the same.
WorkBook.Worksheets(2).Cells.Find(tempString).Interior.ColorIndex = 10;
WorkBook.Worksheets(2).Cells.Find(tempString).Font.ColorIndex = 6;
Enabling the ActiveX component in the web browser
Advantages
Amongst all the well known approaches of generating "Pivot Table" at the client-side like OWC, Embedding Macros in Excel, and several others, this approach is far better. Macros have a lot of limitations; also, OWC components aren't very popular among developers.
Working as a developer since last four years. Enjoys writting code snippets and exploring ASP.Net. You would find me either watching a movie or programming/devloping some reusable code snippets.


 General
  News
News  Suggestion
  Question
  Bug
Bug  Answer
  Joke
Joke  Praise
  Rant
Rant  Admin
Admin 


 however I am unable to run it successfully. Are you able to advise me why I hit the following error at this line onwards:

 , but do visit the following link for converting VB Code to C#