Introduction
Recently, I was working on an issue caused by OOM exception and found out something interesting about String.Split() function. I thought I should share the finding with others and they may also benefit from this analysis in solving OOM exceptions.
It’s a step by step article, I have tried to cover the topic required before starting with the technical details.
Problem
The service causing the issue reads records from a CSV file, keeps them in ASP.NET cache and queries the records using LINQ. Everything was working fine until the records in CSV files were increased from 200k to 1350K (exact 1355049). Within an hour of this change, the service was flooded with OOM exception. The CSV file contains Hexadecimal numbers of length 16 characters in each line separated by comma:
00123456789ABCDE,

0123456789ABCDEF,

…..
Investigation
I knew it was the increase in records which triggered this issue. So without wasting a second, I asked my OPS team to throw up more RAM on servers (now they are 4 GB RAM each server). To my surprise, it did not resolve the issue.
Why did increasing the RAM size of server not solve the problem?
Before I answer this question, a little background is needed:
Virtual Memory: Each process on 32-bit Microsoft Windows has its own virtual address space that enables addressing up to 4 gigabytes of memory which is divided into two partitions: one for use by the process (user mode) and the other reserved for use by the system. Generally, each partition has 2GB of address space. Process requests memory from Virtual address space reserved for that process. A virtual address does not represent the actual physical location of an object in memory; instead, the system maintains a page table for each process, which is an internal data structure used to translate virtual addresses into their corresponding physical addresses. Each time a thread references an address, the system translates the virtual address to a physical address (Address in RAM). The virtual address space is typically divided into pages (a page is block of contiguous virtual address spaces) of size 4KB.
Well, now I know every process can have 4GB of address space but my Physical memory (aka RAM) is limited typically 2GB. Then, how can I accommodate 4GB per process in my Physical memory?
The answer is Page File, a configurable space on hard disk. Page file is used to store pages of a process which can’t reside in Physical Memory.
Let’s draw the picture now (simplified for clarity):
- A process requests memory from OS.
- OS reserves the requested memory from free pages of virtual address space. (Reserved)
- When process uses (read/write/access) part of this memory space, then this memory space is mapped to physical memory (aka RAM). (Committed)
- In case there is not enough space in physical memory to bring in the new pages, then OS removes the least used pages from RAM and saves them in page file (on hard disk). The space created in RAM will be used for mapping newly requested memory. (Page Fault)
In case OS could not find the requested memory (contiguous unused pages) from virtual address space, then it raises out of memory exception. This is exactly what happened in this case, though there was enough free RAM available but there were not enough contiguous unused pages in w3wp.exe processes virtual address space to fulfill the memory request.
The pages of a process's virtual address space can be in one of the following states. (For details, refer to MSDN.)
| State | Description |
| Free | The page is neither committed nor reserved. The page is not accessible to the process. It is available to be reserved, committed, or simultaneously reserved and committed. Attempting to read from or write to a free page results in an access violation exception. |
| Reserved | The page has been reserved for future use. The range of addresses cannot be used by other allocation functions. The page is not accessible and has no physical storage associated with it. It is available to be committed. |
| Committed | Memory charges have been allocated from the overall size of RAM and paging files on disk. The page is accessible and access is controlled by one of the memory protection constants. The system initializes and loads each committed page into physical memory only during the first attempt to read or write to that page. When the process terminates, the system releases the storage for committed pages. |
Now, we know OOM exception is always caused by insufficient contiguous virtual address space, not by insufficient RAM. But to fix the problem, I wanted to see what object is taking most of the space and what is the size of each chunk it requests. Let’s move to the next step.
Finding the Root Cause
Approach
- Start with Perfmon: collect relevant counters and analyze them.
- Debug Memory dump to find the culprit. Perfmon is a very good analysis tool but to find the exact root cause you have to use memory analysis tool. In this case, I used Windbg. Do you know a better tool than Windbg?
What are the causes of OOM exception? Seems one of them:
- Memory Leak in heap
- Fragmentation of virtual memory
- Constantly requesting big chunks of memory
In case there is not enough space in physical memory to bring in the new pages, then OS removes least used pages from RAM and saves them in page file (on hard disk). The space created in RAM will be used for mapping newly requested memory. (Page Fault)
Perfmon Analysis
Collect Counters
- If more than one application pool is running on IIS, then select w3wp.exe process with the largest working set for perf mon monitor. You may use Task Manager for identifying the process consuming largest memory.
- Collect the following performance counters to identify the issue:
- All under .NET CLR Memory\
- Memory\Available MBytes
- Memory\Pages/sec
- Process\Private Bytes
- Process\working set
- Process\virtual Bytes
- Processor(_Total)\% Processor Time
- Web Service\Current Connections
Analysis
Look if we have enough physical RAM
- If memory/ available Mbytes are more than 100 MB, then the system has enough Physical Memory (RAM). So physical RAM is not an issue.
Symptoms of allocating large amount of data frequently:
- Process Counter: If private bytes (memory private to process not shared with any other process), working set (page currently loaded in physical RAM) and virtual bytes (virtual address space currently used by process) all are consistently high, then check pages/sec. If all these counters are showing high values, then it means you are demanding a lot of memory from process, to fulfill your demands, the process does a lot of page-in/page-out activity. If private bytes are anywhere near to 1 GB value, then expect OOM exception to happen any time.
- .NET CLR Memory Counter: Further look at heap memory and checkout 1) committed bytes (memory used by process) 2) reserved bytes (memory reserved by GC for process). If the value of reserved bytes is much higher than committed byte, then your program is requesting memory in big chunks because of which GC would not be able to effectively fill small memory holes in segments, and create a new segment. Though GC is smart enough to adjust the holes in next Gen1/2 collection.
- .NET CLR Memory Counter – Gen0/1/2, Large Object Heap: GC allocates memory in segments and each segment has 3 sections Gen0, Gen1 and Gen2. All objects less than 87KB allocated from Gen0. If there is not enough space in Gen0, then collection for Gen0 is initiated, any object which is not ready for collection during Gen0 is moved to Gen1. And the same applies for Gen1 object. Any object larger than 87 Kb allocated on a separate Large Object Heap (LOH) segment. So increase in size of LOH is a clear indication of large allocation. And increase in size of Gen2 indicates that there are lot of objects which are surviving Gen0 and Gen1 GC. Which indicates memory leak?
In my case, there was a big difference between committed bytes vs reserved bytes and LOH was high which indicated large allocations. So I decided to analyze memory dump of process to find out the object allocating huge memory.
Memory Dump Analysis using Windbg
Take memory dump of w3wp.exe by following steps:
- Download and install debugger from www.microsoft.com/whdc/devtools/debugging/default.mspx
- Open cmd and cd to “C:\Program Files\Debugging Tools for Windows (x86)”.
- When you see OOM exceptions in evenlog, then
- Run command:
adplus -hang -pn w3wp.exe –o c:\dump - Dump files will be stored in directory c:\dump. You may change the directory.
- Also take a copy sos.dll and mscordacwks.dll from the server.
Step 1
Open the memory dump in windbg.
IMP: Load sos.dll and mscordacwks.dll (the one you copied from server). In case you find difficulty in loading sos or mscordacwks.dll, then refer to the article on troubleshooting SOS extension loading issue.
And let’s see how virtual address space of the w3wp.exe is distributed. I have divided the output of !address -summary into 3 parts for better explanation of related parts.
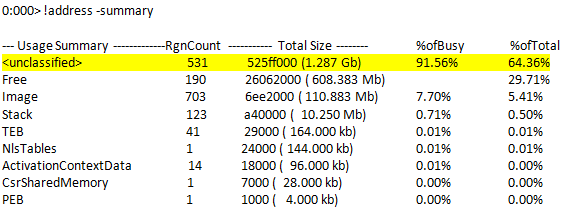
There is some very interesting information here. This is the 2GB (user mode) virtual address space representation for a process. The virtual address space is logically divided into memory regions. Please see the table below (from windbg help on !address) for description of each region:
| Memory Region | Description |
| VAR or <unclassified> | Busy regions. These regions include all virtual allocation blocks, the SBH heap, memory from custom allocators, and all other regions of the address space that fall into no other classification. |
| Free | Free memory. This includes all memory that has not been reserved. |
| Image | Memory that is mapped to a file that is part of an executable image. |
| Stack | Memory used for thread stacks. |
| Teb | Memory used for thread environment blocks (TEBs). |
| Peb | Memory used for the process environment block (PEB). |
| Heap | Memory used for heaps. |
| PageHeap | The memory region used for the full-page heap. |
| CSR | CSR shared memory. |
| Actx | Memory used for activation context data. |
| NLS | Memory used for National Language Support (NLS) tables. |
| FileMap | Memory used for memory-mapped files. This filter is applicable only during live debugging. |
The following 3 tables have detailed out busy part of virtual memory. Busy part is the part of virtual address space which process is using. Generally represents by Process\virtual Bytes counter.

The below table is very informative. This table shows the largest contiguous allocated or available memory in each region. Wow!!! The process is requesting 103 MB in one chunk whereas it now has only 48 MB chunk available. So OOM is expected. Remember OOM occurs when virtual address space does not have large enough contiguous address to fulfill process memory requirement.
Step 2
Let’s find out the object who is consuming 103 MB of virtual address space. Since my application is a .NET application, so I would be inspecting Garbage Collector’s heap using SOS extension command.
My server has 4 processors, that’s why output has 4 heap entries.
See where is most of Heap memory going!!!
Step 2.1: Analyze System.String Type
Let’s analyze last (biggest consumers comes last -)) 3-4 entries (the green highlighted) from dumpheap. I will start with System.String type, as I know I am reading a large CSV file in string and caching it. So I will try to first find it, and I know it contain ~1350K strings, each of size 17 characters (16 hexadecimal character + comma). So the minimum size of string should be around 1,350,000*17*2 (2 byte for each Unicode character) = 45,900,000. I will try find that string using !dumpheap command. The first argument of this command is method table, since I want to analyze string so I am passing MT for string.
Great, I found a big string ( which could be my CSV file) at address 20540038, whose size is 67,010,584 which is bigger than what we calculated for CSV. Let’s confirm whether it's a CSV file on not by verifying the contents. Try with !DO (dumpobject command).
Since it’s a very large string !DO did not print the data. Ok, I will try good old windbg print memory command du (using u for Unicode as I know .NET by default uses Unicode for strings).
Since it’s a very large string, !DO did not print the data. Ok, I will try good old windbg print memory command du (using u for Unicode as I know .NET by default uses Unicode for strings).
0:000> du 20540038
20540038 "ତ礳䀁ǿ.ƈ00010158279b91d4,..00019b0"
20540078 "74c2f8cb1,..00010b074c2f9e5b,..0"
205400b8 "0014b074c2fc01f,..00017b074c2fc9"
……TRIM
……
at, I found my huge string, look at character string of size 17 (00010158279b91d4,) also look at 2 extra whitespace characters represented by (.) dot at the end of each string. They represent line feed and new line characters, because of them the actual size is 67,010,584 than what I initially calculated 45,900,000.
Well, but there is only one instance of this huge string in Heap0 as we have seen in the output of command !dumpheap -mt 79330b24 -min 45900000. So this huge string (CSV file) is not the issue as it is only initialized once. So out of 285,212,628 bytes allocated to string Type, we have only found 67,010,584 byte, Now find where is the rest of my system typ memory, I will find out the size range in which most of the sting objects fall. It’s kind of approximation, so I started with min size of 5000.
Ok, we have majority of allocation below 5000 byte. I decreased min several times and then found out that majority of allocation happened between 50 to 100 bytes
Interesting ~4 million string objects between (50 to 100) exists in GC heap, this is not normal. Let’s see what they contain:
We got the address from the above command, let’s see what it contains.
It contains 00177ffe81d91fa2 the same 16 character string pattern we used in huge string cache (CSV file) we have in memory. All the 3,882,186 string objects are of same size 54 byte. Which suggest there is something like string.split that is used on that huge string (CSV file) which contains comma separated 16 character string. Let’s see where this object is rooted.
The string is rooted to a System.Object[] array having address 148b0048. Ignore invalid objects. Let’s dump this object and see what it contains.
Great, we found out the array resulted from string.split; the number of element matches the number of records in CSV file 1355049. So before we proceed further, let’s regroup what we have seen so far by answering the below question:
What happens when you do a split on a string containing 1355049 comma separated strings of 16 characters each?
- Memory is allocated for an Array to store
string object references: Contiguous virtual address space of 4 (address pointer to string object)*1355049 = 5420196 (arrays size) + 16 (for book keeping) = 5420212. - Memory 1355049 strings: 1355049*54 = ~69 MB.
- <Place holder for surprise> at least to me :)
Are having so many small string objects in memory a problem? Since every string takes 54 bytes, so a split on 1355049 records will take ~69.5MB. Is this a problem? No, because this space is not allocated contiguously on heap, so this is not directly causing OOM. Why? GC allocates anything beyond 87K (contiguous) on LOH (large object heap). Then why data of string.split (total 54*1355049 = 73172646. ~69 MB) is not stored on LOH? The reason is String. Split creates different string object which is not required to be allocated contiguously, so GC could store them wherever it found space in heap. Since the memory requirement of these small string objects goes to OS at the same time so most of the time they are allocated nearby in (SOH) Gen0 Heap. The example proves it:
Look at the highlighted array elements. The address locations of string records are not contiguous.
So far so good. Then what is the issue? The process is only demanding ~5MB of contiguous memory whereas we have 48 MB contiguous free Memory.
Look back largest region by usage.
And what we see from the above is that we only need ~5MB contiguous virtual address space at any given point of time. I agree with 5MB allocation per split we might see OOM as the number of current connections reaches in the range of 1000’s connection. But in the present dump, there is something else which is causing OOM. Let’s see what it is. Do you remember !dumpheap –stat?
Step 2.2: Analyze System.Int32[] Type
We have not yet analyzed the largest consumer of .NET heap ->System.Int32[]
We analyzed System.Object and System.String. But not the largest consumer of GC heap System.Int32[].
Let’s start with finding the range where maximum memory consumed.
OOPS!!! These are some really big chunks of memory. But who on earth is consuming them? All of them are of equal size, let’s do dump object of the first one.
Remember what is the size of CSV file when loaded in memory cache (Fig7)? Iterate through the array using !dumparray will reveal that this array contains integer data in the sequence of 16, 35, 54, 73,….. 25745909,0,0,0…0.
This tells the character position for next split for string.split function.
The last split happened at 25745909 at index 1355047. So (25745930 – 1355047 =) 24390883 elements contains zero value. I don’t understand why string.split has been designed in such a way?
So the size of array is 4*25745930 = 102983720 + 16 (for book keeping) = 102983736.
We Found the Issue
I guess we found the major cause of OOM in this case. IT’S THE implementation of SPLIT function (of course, doing multiple split on unchanged large in-memory string is equally bad).
Let’s revisit:
What happens when you do a split on a string containing 1355049 comma separated strings of 16 characters each, having total character length of 25745930 ?
- Memory is allocated for an
Array to store string object references: Contiguous virtual address space of 4 (address pointer to string object)*1355049 = 5420196 (arrays size) + 16 (for book keeping) = 5420212. - Non-contiguous virtual address space for 1355049 strings, each of 54 bytes. It does not mean all those 1.3 million
strings would be scattered all across the heap, but they will not be allocated on LOH. GC will allocate them in bunches on Gen0 heap. Split.Function will create internal array of System.Int32[] of size 25745930, consuming (102983736 bytes) ~98MB of LOH, which is very expensive L.
Well I know what the issue is. But how can I get away with this issue without changing the code??? I will cover the solution in the next blog.
References
This member has not yet provided a Biography. Assume it's interesting and varied, and probably something to do with programming.


 General
  News
News  Suggestion
  Question
  Bug
Bug  Answer
  Joke
Joke  Praise
  Rant
Rant  Admin
Admin 


