Table of Contents
Other Articles in the Log Wizard Series
Introduction, Filters, Notes
Viewing Windows Event Logs can get pretty painful. The default Event Viewer has a weird UI, to say the least (it's wasting a lot of space, for one). To the existing alternatives, I'm here to add a new one - Log Wizard.
I created Log Wizard to help anyone easily filter through logs in order to identify bug(s) and/or issue(s). It allows for several types of logs, and as of version 1.7, it allows for Windows Event Logs as well. I host it on github, and the plan is to get a new release out every 3-4 weeks or so.
The process of viewing, filtering and/or searching has to be extremely easy. If this is not the case, I clearly did something wrong - let me know!
Once you start Log Wizard, it will wait for you to open a Log. Just press Ctrl-O (equivalent of Actions >> Open Log).
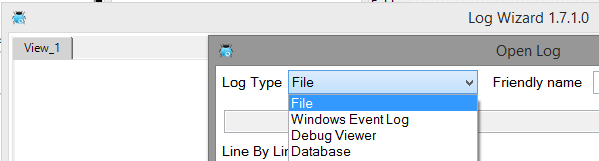
Select Windows Event Log and then press OK. Events will start coming in - as they show up, you'll see the progress in the status bar. Depending on the size of your Event Logs, this may take a few seconds, but the UI is responsive at all times.
I will show you events from the Application and the System Event Logs, bundled together.
Note that the latest events come first - thus you can have a quick look at what happened last while still waiting for the older events.

As a sneak peak, just try the Ctrl-F (Find), type something (even regexes), and enjoy the preview. Or, try Ctrl-G (Go to Line/Time) and type something like -10h (go to 10 hours ago relative to your selected row), or -2.5d (go 2.5 days ago).
Or, just roam through the events, and see that I've done my best to use every bit of space to show relevant information. You can toggle information on/off until you only see what is important to you.
Once you've pressed Ctrl-O, and selected Windows Event Log, you can of course tweak a few things to your liking:
First thing to note is that you can look at several (Windows Event) Logs at a time. They will be sorted by date/time. You can open Local Logs (default), or Remote Logs (more on that in a bit).
Opening Local Logs
In Event Log(s) text box, you can type the name of any Windows Event Log - and as soon as it's recognized, the green "OK" is shown (one entry per line).
Or, you can check/uncheck logs from the list shown below the text box (this is clearly easier :) ) - the text box will update, to reflect your choices.
The problem with the list shown below the box is that you're not guaranteed that the list is complete. To enumerate all Windows Event Logs is rather cumbersome and close to impossible. In .NET, we have EventLog.GetEventLogs([remote_machine_name]), but this will only return a very few log names. Or simply put, the usual ones. It won't even show the System log!
To get around that, I will go pay a visit to C:\Windows\System32\winevt\Logs - and show the more recently updated files. Unfortunately, that is a very long list, and most of the logs are empty.
The only way to know if such a log is empty or not is to open it and start reading from it. This is of course, time consuming. As you will come to see, everything is time consuming, when it comes to reading Windows Event Logs.
To help you realize which logs are worth pursuing, I've provided the Test button below the Event Logs. It will open a new window and show you which of the logs you selected have any entries - and it will also show you the number of entries of each log (it works even for remote machines, assuming you've set the password properly).
Once you're comfortable with your choice, just click OK at the bottom, and Log Wizard will start collecting and showing the information in the Log(s).
Opening Remote Logs
You can connect to Remote Logs as well. I've made it so that the process is as seamless and painless as possible. To connect to a remote machine, you will need to provide the machine name, domain, username and password.
When you've set them, you will see a Test button that shows you whether you've managed to connect to the remote machine or not. When you manage to connect, the (checked) list of Event Logs updates.
You can check/uncheck logs from that list or manually type the name of a Windows Event Log from the remote machine. As soon as the name is correct, you will see the green "OK".
Click the OK at the bottom, once you've selected the Logs you wanted to view. Log Wizard will now collect and show you the information in the Log(s).
One thing to note is that Log Wizard remembers your choices, so next time you open Log Wizard, it will re-open what you just selected now. In case you connected to a remote machine, it will not store the password locally - it will force you to re-enter it. Once the password is correct, it will re-read the logs and show them to you.
As I already said, I don't like wasting (UI) space. Anything you don't like, you can turn off. Here's what I mean:
The View Pane
Depending on the type of your log, it may contain lots of columns. In the View Pane, you want to have the best mix of "summary/detail", so that you don't have too many columns, but not too few either. In the case of Windows Event Logs, by default, I show you the Message, Line, Date, Time, Level (the rest are shown in the Details Pane).
You decide what matters to you: first, you can resize the columns and/or move them around. To move a column, right click its header. A menu will show up, and you can move that column to its left or right (see the bottom actions).
You can also show/hide any of the columns - just right click on any column header. Here, I just showed the Log and Category:
The Details Pane
By default, the Details Pane shows everything except Line, Date, Time, Level columns. They are shown in the first row (which is fixed), and the second row is mobile, where the full Message is shown. You can of course resize the Details pane and/or customize it.
When you customize the Details Pane, you can show/hide columns, and specify where (in what row) they are shown. Right click on it, and select "Edit Description Layout".
You should be able to easily modify it to what you want. For instance:
Toggle Away!
Anything you don't want can be toggled off. Even the Details Pane! Just Alt-D it OFF, and then press Alt-D to turn it back ON. Or the Status bar - Alt-S to turn it ON/OFF.
You can even toggle of the title bar (Alt-T):
To see what you can toggle ON/OFF (and instantly see what it means), you can press Actions >> Show/Hide Information (you have to have the Status Bar shown for the Actions button to be visible).
This is one of the places where Log Wizard truly shines. Anywhere you're in the Log, just type Ctrl-F (Find).
You can search for anything, with instant preview (of surrounding 1000 rows):
As you can see, searching for regexes is a bliss. Few things to note:
- By default, Log Wizard searches all columns. You can turn it off, and in that case, it will only search within the Message column
- Log Wizard tries to guess if your text is a regex or not. You can override that
- Your search is saved, so that next time you do Ctrl-F you can re-select it.
Once you press OK, it will take you to the first result:
You will see that the found text is shown in bold, and in a different background, so that you can easily visually see the results.
If your search will take you to some place where the result is not visible in the View (only in the Details Pane), Log Wizard will show the full line in a different background (here, searching for .net runtime)
In the above case, line 55534 contains .net runtime text in the Source column.
You can easily navigate within the results - just do F3 (Find Next) or Shift-F3 (Find-Previous).
The F3/ Shift-F3 are relative to your currently selected row. You can go to any row, and press F3 or Shift-F3 - the search will continue from there. Or...
You can easily toggle seeing only the results-of-the-search. Just press Ctrl-Alt-F, and here's what you'll see:
Press it again, and you're back to seeing the full Log.
To stop the search (and stop the coloring of found words), just press ESCAPE.
While examining the Window Event Log(s), just like with any log, there will be a lot of information you don't care about. So, you can simply filter it out. Log Wizard provides 3 types of filters:
- Exclude Filters (you will exclude rows from your View)
- Include Filters (you will include rows from your View - all
Include filters are ORed) - Color Filters (you can apply pretty colors to certain rows)
One thing to note is that your Find (Ctrl-F) will work on your existing View. Namely, Find command will ignore every row what you've excluded by filtering.
I've explained Filters in dept here. To easily color some words, just select them, right click, Set Color of Lines >> Match Color, select the color, and that's it. In this case, resolution is shown in blue, and ping is shown in red.
When you've filtered out stuff, and you quickly want it back, just toggle it in - Ctrl-Alt-L - this will show all rows from the Log, and those lines that are excluded will be shown in gray.
In the above case, I excluded all lines starting with Installation Failure.
Another way to navigate though your log is to go to a specific line or date/time. Just press Ctrl-G (Go to).
The Go to works in two ways:
- go to an exact line or date/time, OR
- go to an offset line or date/time - just prefix with + or - and this will be an offset.
The dialog is pretty self explanatory and handles quite a lot of date/time formats. It also shows you in real-time where it will go. For instance:
-2.5d will show you a tip like "Before 216000 secs" (2.5 days before),11/20 will say "To Date 2016/11/20 00:00:00.000"11/19 2:4 will say "To Date 2016/11/19 02:04:00.000"+10h will say "After 36000 secs" (10 hours after)
So, you've selected your Windows Event Log(s) to open, and are now nicely looking at them.
As new events are recorded - in any of the Log(s) you've open, you will see them in real-time. It automatically refreshes.
If by any chance you're on the first line (since for Windows Event Logs, latest entry is shown first, by default), you're automatically scrolled to the new entry.
Log Wizard is smart, and remembers everything. Your toggles, your window position, your filters, and so on. And amongst the things it remembers: History of the last Logs you opened.
By default, when you start Log Wizard, it will auto re-open your the Log you opened last time. You can turn this off in Preferences (Ctrl-P) - Automatically Open Last Log On Restart.
Just assuming you've turned off the Automatically Open Last Log On, there's no point in calling Actions >> Open Log every time to re-open Windows Event Logs you opened last time. Just go to Actions >> Show History, or Ctrl-H, and select the last log.
By default, the Last Log is in fact selected, so to do it even faster, you can consider Ctrl-H, Enter as the shortcut to re-open your last log.
Just as a side note, Log Wizard, besides Windows Event Logs, and files, can also monitor Debug Viewer entries - this is just anything an application writes using OutputDebugString. Or, for us C# users, anything written using Debug.Write[Line], or Trace.Write[Line]. So for instance, it can catch this:
static void Main() {
    Application.EnableVisualStyles();
    Application.SetCompatibleTextRenderingDefault(false);

    Debug.WriteLine("debug - this is the beginning");
    Trace.WriteLine("trace - this is the beginning");
    Application.Run(new Form1());
    Trace.WriteLine("this is the end");
}
When you open a new log - Ctrl-O or Actions >> Open Log, select Debug Viewer. You'll see this:
You can filter the events by a certain application name, or show all events (depending on your running applications, this could get pretty crowded). Assuming your app is called Windowsformsapplication1, just type it in there (upper/lower case doesn't matter), and press OK. Run your application. You'll see something like this:
Pretty cool. ;)
Creating (and optimizing) a Windows Event Log viewer was, I have to admit, much harder than I initially expected. Anyway, it was quite a lot of fun.
What would you want from such a Log Viewer? What's you favorite feature?
If it's not already here, I'll do my best to implement it:
- drop a note in the comments below, or
- add an issue on github
When you open Event Viewer and open an Event Log, it's quite fast. But when you view the same log from an external application, things happen much slower. Why is that?
If you Google reading event logs in .NET, you'll see people complaining about this big time. Seems Microsoft doesn't really care. So you have two choices really:
- Fast results, but the UI sucks big time (Event Viewer)
- Slower results, but you can choose how to show them, thus allowing you to have a much nicer UI
If you want to query Windows Event Logs outside the Event Viewer, you have two choices:
- Go really low level (Win32 API - Event Log Reference and Example). If you take a look at the example, you'll see why I avoided it.
- Use the high level and easy to use .NET API. It's a few times slower.
So I chose the latter version. Why is it so slow? I don't know - I can tell you where the bottlenecks are, and the rest are simply my guesses.
Using one of the .NET APIs, you can query a Windows Event Log (using an XPATH query), and then process each record.
Walking through the query is pretty fast. Enumerating some of its important properties are the bottlenecks:
- getting the event's
Category (EventRecord.TaskDisplayName) - getting the
Message itself (EventRecord.FormatDescription())
The FormatDescription() is very slow - on my (very fast) machine - it's about 2-3ms / call.
You should know that a lot of the EventRecord properties/methods throw a lot of exceptions. I'm guessing it's because the underlying code checks for user credentials (is user allowed to actually see the event?).
For instance, if your Windows account does not belong to "Event Log Readers" user group, reading the log will be MUCH slower.
The cost of having exceptions thrown is extremely high - sometimes 2000x fold or more (see here and here) - and you can have even more than one exception thrown when reading an event's details.
My personal take on this is that the EventRecord class is implemented very poorly - first of all, there should be a way to invoke its methods/properties without any exceptions being thrown.
But even worse, in FormatDescription(), there seems to be a global (mutex) lock - so that no two threads can access two different EventRecord' descriptions. I tried to do a Parallel.For for reading the details of 5000 events. To my surprise, the code executed in the same amount of time as reading those events in a single thread, with the only difference that using Parallel.For actually used close to 100% CPU (of my 8 logical CPUs), while doing it on a single thread used pretty much 6-8% of my CPU.
Avoiding FormatDescription() is pretty much impossible - but do let me know if you know of a way.
- 21 Jan 2016, Initial version (1.7)
Author of LogWizard.


 General
  News
News  Suggestion
  Question
  Bug
Bug  Answer
  Joke
Joke  Praise
  Rant
Rant  Admin
Admin 


