Click here to Skip to main content
15,885,757 members
Articles / Web Development / ASP.NET / ASP.NET Core
Tip/Trick

Debugging with Chrome in Visual Studio 2017

Rate me:
Please Sign up or sign in to vote.
4.90/5 (10 votes)
29 Jun 2017CPOL1 min read 42.2K   6   4
In this post, we are going to explore how to debug client side script in Visual Studio 2017 using Chrome and how to disable it.

Introduction

Debugging client side script using IDE is a most exciting feature in Visual Studio 2017. Recently, I updated my IDE and after creating a new ASP.NET Core application, I noticed the below splash screen before starting the application. Later, I realized the new exciting feature and then I decided to explain it to others.

This screen is nothing but the information about debugging script using Visual Studio.

Let’s break those points:

Image 1

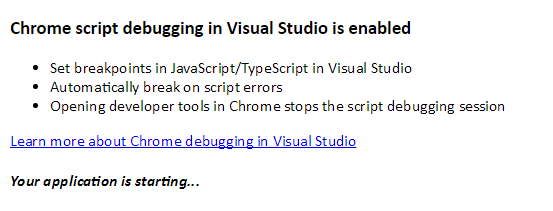
1. Set Breakpoint in JavaScript/TypeScript in Visual Studio

Here we go, let’s write some js code in Site.js file

JavaScript
// Write your Javascript code.
function sum() {
    var value = (1 + 2);
    console.log(value);
};

Set breakpoint like the below screen using IDE in Js file.

Image 2

It hit the breakpoint while reloading the page, in Internet Explorer, this will hit on initial page loading. Use (F10/F11) to continue debug.

Image 3

2. Automatically Break on Script Errors

Let’s create an error, update the previous function in js file, our below code snippet will cause a range error at runtime.

JavaScript
// Write your Javascript code.
function sum() {
    var value = (1 + 2);
    console.log(value);

    var num = 1;
    num.toPrecision(500);
};

Hit F5 using Internet Explorer, like below screen, it’ll automatically hit the break point while script error occurs.

Image 4

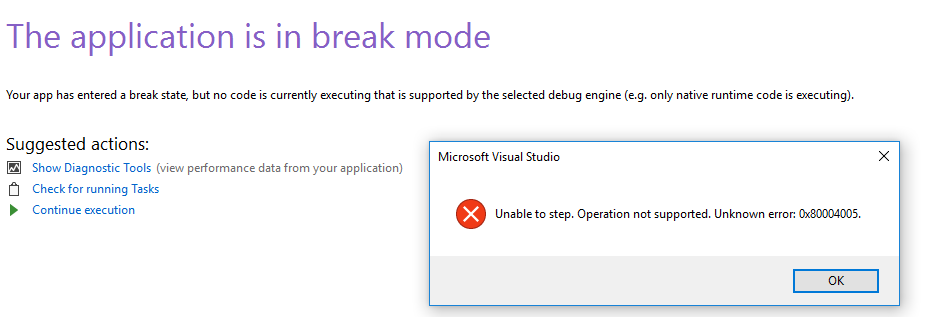
3. Opening Developer Tools in Chrome Stops the Script Debugging Session

Image 5

As you can see while I was switching to Developer tools in Google Chrome at debug session, the application stops debugging.

Image 6

Disable Debugging

Go to Tools -> Options -> Debugging -> General and...

Image 7

Uncheck/Clear the setting Enable JavaScript Debugging for ASP.NET (Chrome and Internet Explorer).

Image 8

Get more on it: https://blogs.msdn.microsoft.com/webdev/2016/11/21/client-side-debugging-of-asp-net-projects-in-google-chrome

Hope this will help! :)

License

This article, along with any associated source code and files, is licensed under The Code Project Open License (CPOL)


Written By
Software Developer (Senior) s3 Innovate Pte Ltd
Bangladesh Bangladesh
Hi, I am Shashangka Shekhar,

Working with Microsoft Technologies. Since March 2011, it was my first step to working with Microsoft Technologies, achieved bachelor’s degree on Computer Science from State University of Bangladesh(Dhaka). Have 12+ years of professional experience, currently working as Technical Lead at Surbana Jurong Private Limited.

I believe in desire of learning & also love to be a part of .Net Community by sharing knowledge’s.

Comments and Discussions

 
QuestionDebugging doesn't work Pin
rkb21-Nov-17 7:03
rkb21-Nov-17 7:03 
I open a project and hit F5 and I get the page that my application is starting (the same page as shown at the first of this article). Down below I get a message "Waiting for localhost". But it just spins with no response. Ideas?

Kevin Burton
rkevinburton@charter.net
Questionfew images are missing Pin
Mou_kol29-Jun-17 0:23
Mou_kol29-Jun-17 0:23 
AnswerRe: few images are missing Pin
Shashangka Shekhar29-Jun-17 0:27
professionalShashangka Shekhar29-Jun-17 0:27 
GeneralRe: few images are missing Pin
Mou_kol29-Jun-17 0:30
Mou_kol29-Jun-17 0:30 

General General    News News    Suggestion Suggestion    Question Question    Bug Bug    Answer Answer    Joke Joke    Praise Praise    Rant Rant    Admin Admin   

Use Ctrl+Left/Right to switch messages, Ctrl+Up/Down to switch threads, Ctrl+Shift+Left/Right to switch pages.