In this article, I would like to describe monitoring the health of your application in Windows Azure via Performance Counters. The topic came out as a result of working on a health monitoring aspect of an Azure Application where I had to implement means for the system to give feedback to the user. I believe that Azure Diagnostics should be part of every application and value of your app instrumentation cannot be underestimated. In this article, I will focus on performance counters and will provide a working code example.
Some Theory
The health of your Azure application is monitored via Azure Diagnostics, an API in Microsoft.WindowsAzure.Diagnostics assembly. Windows Azure Diagnostics provides a variety of tools to check the health of your Azure app. Such tools include:
- Logs
- Windows Events
- Performance Counters
- Crash Dumps
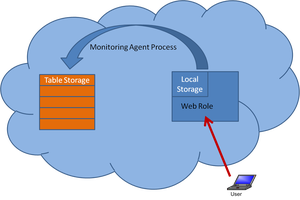
Using Azure Diagnostics API, you can configure your Web Role or Worker Role to collect the health information. The health information is stored on a local file system. From time to time, the health information is transferred into a TableStorage by a Monitoring Agent as shown in Fig.1.

Figure 1. Azure Diagnostics in Action
Enough said, let us see some code!
First, we need to configure the diagnostics API to use the proper storage account, file quota, and frequency of health information transfer:
private void ConfigureDiagnostics()
{
    var cloudStorageAccount = CloudStorageAccount.Parse(
        RoleEnvironment.GetConfigurationSettingValue(DIAGNOSTICS_CONNECTIONSTRING));

    var roleInstanceDiagnosticManager =
            cloudStorageAccount.CreateRoleInstanceDiagnosticManager(
            RoleEnvironment.DeploymentId,
            RoleEnvironment.CurrentRoleInstance.Role.Name,
            RoleEnvironment.CurrentRoleInstance.Id);

    var cfg =
        roleInstanceDiagnosticManager.GetCurrentConfiguration() ??
        new DiagnosticMonitorConfiguration();

    cfg.PerformanceCounters.DataSources.Add(
    new PerformanceCounterConfiguration()
    {
        CounterSpecifier = @"\Processor(_Total)\% Processor Time",
        SampleRate = TimeSpan.FromSeconds(5)
    });
    cfg.PerformanceCounters.ScheduledTransferPeriod = TimeSpan.FromSeconds(1d);
    cfg.PerformanceCounters.BufferQuotaInMB = 512;

    roleInstanceDiagnosticManager.SetCurrentConfiguration(cfg);
}
With that, my worker role is now collecting the CPU utilization every 5 seconds and writing it every minute to the ADPerformanceCountersTable in the Developer Storage.
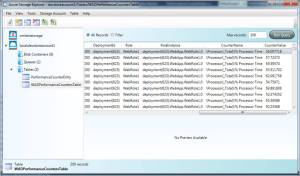
If we just run the WebRole, we will be able to see the perf counters recorded in the WADPerformanceCountersTable:

Figure 2. WADPerformanceCountersTable
Next, we need to define data structures to work with every WADPerformanceCountersTable:
public class PerformanceCounterEntry :
Microsoft.WindowsAzure.StorageClient.TableServiceEntity
{
public PerformanceCounterEntry()
{
}
public string Timestamp { get; set; }
public long EventTickCount { get; set; }
public string DeploymentId { get; set; }
public string Role { get; set; }
public string RoleInstance { get; set; }
public string CounterName { get; set; }
public string CounterValue { get; set; }
}
public class PerformanceCounterDataContext : TableServiceContext
{
public PerformanceCounterDataContext(string baseAddress,
StorageCredentials credentials)
: base(baseAddress, credentials)
{ }
public IQueryable PerformanceCounterEntry
{
get
{
return this.CreateQuery("WADPerformanceCountersTable");
}
}
}
public class PerformanceCounterEntryDataSource
{
private static CloudStorageAccount storageAccount;
private PerformanceCounterDataContext context;
static PerformanceCounterEntryDataSource()
{
storageAccount = CloudStorageAccount.FromConfigurationSetting(
"DataConnectionString");
CloudTableClient.CreateTablesFromModel(
typeof(PerformanceCounterDataContext),
storageAccount.TableEndpoint.AbsoluteUri,
storageAccount.Credentials);
}
public PerformanceCounterEntryDataSource()
{
this.context = new PerformanceCounterDataContext(
storageAccount.TableEndpoint.AbsoluteUri, storageAccount.Credentials);
this.context.RetryPolicy = RetryPolicies.Retry(3, TimeSpan.FromSeconds(1));
}
public IEnumerable Select()
{
var tempResults = (from pc in this.context.PerformanceCounterEntry
where pc.EventTickCount > DateTime.Now.AddMinutes(-10).Ticks
select pc).ToList();
var results = tempResults.OrderByDescending(pc => pc.EventTickCount).Take(20);
return results;
}
}
Now, all we need to do is to show TOP 20 counter records in the DataGrid:
<asp:ScriptManager ID="ScriptManager1" runat="server">
</asp:ScriptManager>
<asp:UpdatePanel ID="UpdatePanel1" runat="server">
    <ContentTemplate>
        <asp:DataGrid
            ID="DataList1"
            runat="server"
            DataSourceID="ObjectDataSource1"
            CellPadding="10" AutoGenerateColumns="false">
                <Columns>
                    <asp:BoundColumn DataField="TimeStamp"
                    HeaderStyle-Font-Bold="true"
                    HeaderText="TimeStamp" ReadOnly="true"/>
                    <asp:BoundColumn DataField="CounterName"
                    HeaderStyle-Font-Bold="true"
                    HeaderText="Counter" ReadOnly="true"/>
                    <asp:BoundColumn DataField="CounterValue"
                    HeaderStyle-Font-Bold="true"
                    HeaderText="Value" ReadOnly="true"/>
                </Columns>
            </asp:DataGrid>
        <asp:Timer
            ID="Timer1"
            runat="server"
            Interval="15000"
            OnTick="Timer1_Tick">
        </asp:Timer>
    </ContentTemplate>
</asp:UpdatePanel>
<asp:ObjectDataSource
    ID="ObjectDataSource1"
    runat="server"
    DataObjectTypeName="WebRole1.Data.PerformanceCounterEntry"
    InsertMethod="WebRole1.Data.PerformanceCounterEntry"
    SelectMethod="Select"
    TypeName="WebRole1.Data.PerformanceCounterEntryDataSource">
</asp:ObjectDataSource>
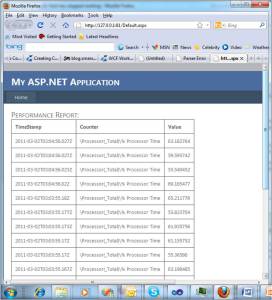
Now we are ready to run the application. This is the result I got:

Figure 3. Performance Report
Conclusion
One can never undervalue good instrumentation of your apps with diagnostics. In this post, I have discussed how to integrate performance counters into your Azure application. The article demonstrates the integration of a CPU utilization performance counter via a code sample.
This member has not yet provided a Biography. Assume it's interesting and varied, and probably something to do with programming.
 General
  News
News  Suggestion
  Question
  Bug
Bug  Answer
  Joke
Joke  Praise
  Rant
Rant  Admin
Admin 


