Introduction
Ever since working on Unix systems, I have been accustomed to using
trace and other forms of logging to facilitate debugging. Of course, nothing can replace
breakpoints and stepping through code, but the problem with breakpoints is
that you cannot check them in, and expect them to still be there the next time
you work on that code. Even if you could somehow "lock" breakpoints, there is
no way to annotate them. After a while, you will forget why you had that breakpoint
set on that line, and why that line of code was important. Trace statements, on the other hand,
will persist, and will serve to remind you of what is important at key points in the code,
and will help other programmers if they need to maintain it.
MFC's TRACE statement is very popular, and when I started .Net
programming I looked to see if there was anything comparable. While .Net has
basic trace features, there were two things I really missed:
- Printf-style formatting,
which allows for compact single-line statements, using well-known
CRT format specifications.
- The ability to double-click on line in Output Window, and have
caret move to that source code file and line in the editor.
This article presents my solution to these missing features.
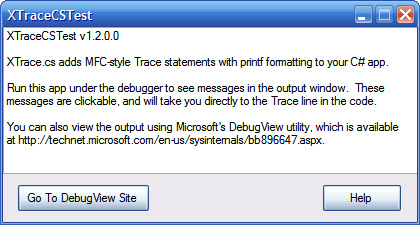
Demo App
To illustrate
XTrace.cs features, I put together this simple Forms demo:
When you run this app under debugger, you will see trace output in Output Window:

The above screenshot shows how you can double-click in Output Window. By default,
source file name is outputted as filename.ext, but when running under
debugger, XTrace.cs outputs full path, thus enabling ability to double-click.
A Closer Look
Unless I am trying to find bug, I usually do not run under debugger. However, I still
would like to see trace output, and to do this I use excellent free
DebugView
written by Mark Russinovich. This utility captures
OutputDebugString()
output and displays it using optional include/exclude and color highlight filters.
The following screenshot shows
DebugView
in action with demo app:
I added green and red highlight colors to
DebugView
by using highlight filters I mentioned. It is very easy, for example,
to turn on different color highlights by including trigger strings such as "=====" or "~~~~~"
in Trace line. You see the effect of two trigger strings I have set: "in "
produces green, and "ERROR" produces red. Using colors in this way is enormous help
when you are scanning hundreds of lines of trace output.
To make trace output more useful when running under debugger,
XTrace.cs outputs both Win32 thread ID (which the debugger displays)
and .Net logical thread ID.
To see how printf formatting works, consider line #1 in the above
DebugView
screenshot. This line is produced by this code:
DateTime t = DateTime.Now;
string s = AssemblyTitle;
XTRACE.XTrace.Trace("Started %s at %d:%02d:%02d", s, t.Hour, t.Minute, t.Second);
The %s is replaced by assembly title, retrieved using reflection,
and time values are displayed using %d (or %02d, when leading zero
is desired).
XTrace.cs Format Specifiers
The following table lists most common printf type characters, which (after the %)
is the only required format character; it appears after any optional format fields.
The type character determines whether associated argument is interpreted as
character, string, or number.
| Printf Format Specifiers Quick Reference |
|---|
| Character | Type | Output |
|---|
| c | int | Single character. |
| d | int | Signed decimal integer. |
| i | int | Signed decimal integer. |
| o | int | Unsigned octal integer. |
| u | int | Unsigned decimal integer. |
| x | int | Unsigned hexadecimal integer, using "abcdef." |
| X | int | Unsigned hexadecimal integer, using "ABCDEF." |
| e | double | Signed value having the form [ – ]d.dddd e [sign]ddd where d is a single decimal digit, dddd is one or more decimal digits, ddd is exactly three decimal digits, and sign is + or –. |
| E | double | Identical to the e format except that E rather than e introduces the exponent. |
| f | double | Signed value having the form [ – ]dddd.dddd, where dddd is one or more decimal digits. The number of digits before the decimal point depends on the magnitude of the number, and the number of digits after the decimal point depends on the requested precision. |
| g | double | Signed value printed in f or e format, whichever is more compact for the given value and precision. The e format is used only when the exponent of the value is less than –4 or greater than or equal to the precision argument. Trailing zeros are truncated, and the decimal point appears only if one or more digits follow it. |
| G | double | Identical to the g format, except that E, rather than e, introduces the exponent (where appropriate). |
| s | string | Specifies a character string. Characters are printed up to the first null character or until the precision value is reached. |
XTrace.cs API
The following methods are available:
Methods |
| | void Trace(string format, params object[] parameters)
| Outputs file name, line number, thread ids, followed by formatted args. |
| | void TraceEnter() | Outputs file name, line number, thread ids, followed by "in" and method name.
|
| | void TraceEnter(string format, params object[] parameters) | Outputs file name, line number, thread ids, followed by "in" and method name,
plus formatted args. |
| | void TracePoint(string desc, Point point) | Outputs file name, line number, thread ids, followed by desc and point. |
| | void TraceRect(string desc, Rectangle rect) | Outputs file name, line number, thread ids, followed by desc and rect. |
| | void TraceSize(string desc, Size size) | Outputs file name, line number, thread ids, followed by desc and size. |
The above APIs will produce output only in DEBUG build. You can change this by commenting out
the [Conditional("DEBUG")] lines, and changing Debug.WriteLine
to System.Diagnostics.Trace.WriteLine.
How To Use
To integrate
XTrace.cs into your project, add the files
XTrace.cs and
HDTools.cs.
See the demo app for examples.
Acknowledgments
My thanks to Richard Prinz for his excellent article
A printf implementation in C#.
If you find XTrace.cs useful, please take a minute to visit Richard's
article and vote him a 5.
Revision History
Version 1.2
Usage
This software is released under the
Code Project Open License (CPOL).
You are free to use this software in any way you like, except that you
may not sell this source code. This software is provided "as is" with no expressed or implied warranty.
I accept no liability for any damage or loss of business that this
software may cause.


 General
  News
News  Suggestion
  Question
  Bug
Bug  Answer
  Joke
Joke  Praise
  Rant
Rant  Admin
Admin 


 I spent the weekend working on a custom membership provider and ended up writing to the event log as I tried to find the issue.
 TraceEnter by itself got you a 5 from me. The rest will find a home in my toolbox.
 switching between the two is confusing)
