I have a spreadsheet where I write down how many hours I sleep each day – I have been doing it for roughly a year. This information already provided me with a lot of insight about my patterns of sleep and helped me improve my discipline, but in a never-ending quest for better understanding, I have been recently looking for other ways to analyze that data. This is when spectral analysis came to my attention.
As you probably know, every sequence of numbers that change over time can be thought of as a (discrete) signal in time domain – just like audio wave file. However, it's hard to understand certain periodic properties of such a signal by simply looking at it – it often looks random or noisy. Transforming signal from time domain to frequency domain may provide additional insight about how the signal was generated.
So I was intending to do discrete Fourier transform of a “signal” of my sleep times sampled once per day when an (pretty obvious in hindsight) idea struck me – the same process can be used to detect regular patterns in performance of a computer program! E.g. we could sample how much CPU power a certain process uses in a given moment of time, essentially creating a time domain signal, which can be then transformed to frequency domain and analyzed to detect periodic hitches, if any.
Detect Your Garbage Collector
In applications that continuously render video frames - like games - we can analyze a specific signal consisting of “frame times” (with sampling “frequency” of “once per frame”). That way, we could detect regular hitches between frames which may go unnoticed when looking at time domain signal, but might still be felt by players and contribute to "jerky" impression of the game.
I did a few experiments to evaluate the practical usefulness of this idea. For instance, consider these two sequences of numbers:
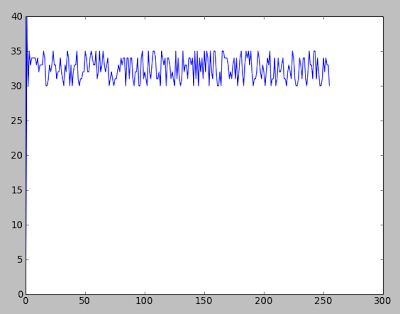
(Fig. 1a)

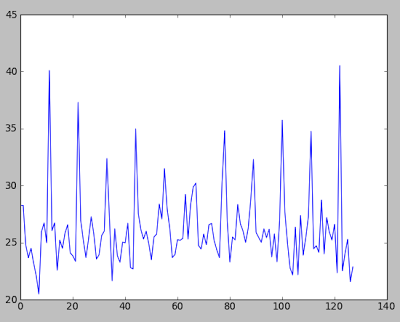
(Fig. 2a)
They looks quite similar in time domain, yet they are very different: first sequence (fig. 1a) consists of uniformly distributed random numbers from 30 to 35, while in the second sequence (fig. 2a) each 23rd sample was incremented by a random number from 1 to 5 to simulate slight hitches.
(NOTE: For demonstration purposes, I altered first two samples to bring graphs to the same range - my matplotlib knowledge sucks :) )
Now, let's look at their spectra after DFT (which have been modified to make them readable, more on this later):

(Fig. 1b)
(Fig. 2b)
We cannot see anything useful in fig. 1b – it's basically noise (well, we might attempt to infer properties of pseudorandom generator it was generated with :) ), whereas fig. 2b is much more meaningful – we can clearly see spikes that correspond to certain frequencies found in the time domain signal 2a.
If we look deeper, we can find out that the first spike is located at about x=11 “frequency”, so sample with larger amplitude (a hitch!) is repeated roughly 11 times in our time domain signal. Given that the signal was 256 samples (“frames”) long, that means that we are hitching every 256/11 ~= 23.27 frame – that is, we were able to detect the unobvious property of original figure 2a.
Practical Limitations
There's little cheating here: the above spectra in figures 1b and 2b are not really produced from the said 256 samples – due to reasons described elsewhere, these are averaged spectra from larger set of samples of the same signals. That is, in order to produce the above figures, I averaged 64 spectra of 256-sample segments, totalling 16384 samples (frames) - this helps in reducing spectral noise. In practice, that means that in order to bring out features that happen at most each 256 frames (roughly 8.5 seconds at 30 fps), we may need to sample data for about 9 minutes – which perhaps severely limits usefulness of this approach.
(We may also try alternative approaches like padding original signal with zeroes and performing 1024-sample or larger DFT, which increases resolution of the spectrum - and then averaging the said spectrum with some simple filter like box: this approach is reportedly also effective at reducing noise).
Also of note, to make spectrum readable, I artificially removed the first sample of it (more exactly, made it the same as the second one), essentially chopping off the DC.
Just for fun, here are the results of sampling another application (a Video4Linux camera frame grabber of mine) which runs well above 100 fps, with average frame time being around 6 ms:
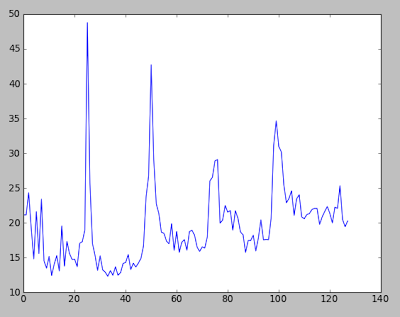
What can we say about that? First spike is at about 24.665, that means that roughly each 10 frames, there was a hitch. Given 6ms frame time, it means that hitch happened (again, roughly) each 60 ms, or 16.7 times per second. It is hard to explain that – possibly that was caused by camera driver or even the very logging of frame times to file.
Summing Up
Detecting periodic jerkiness is not that useful if we cannot measure how hard it is. Estimating 'power' of a hitch can be probably done by comparing power (of a signal) at each frequency. That way, we can perhaps come up with some measurable (and scalar) characteristic of how 'hitchy' our program is, however, I am not sure what would be the best method to calculate that.
Spectral analysis is a broad topic, and I am only scratching the very surface of it with this post.
This member has not yet provided a Biography. Assume it's interesting and varied, and probably something to do with programming.


