Introduction
Graphs can be very useful in Windows-based applications for pictorially displaying information and statistics. There are a number of tools that will allow you to create graphs for display within your applications. However, it isn't always feasible to purchase licenses for these tools, especially if the application is relatively simple or is constrained by a low budget. In this article, we'll focus on creating line point graphs using the Microsoft .NET Framework. This will involve using classes in the System.Drawing namespace. The component uses GDI+ that provides considerable support for transforming between different coordinate systems.
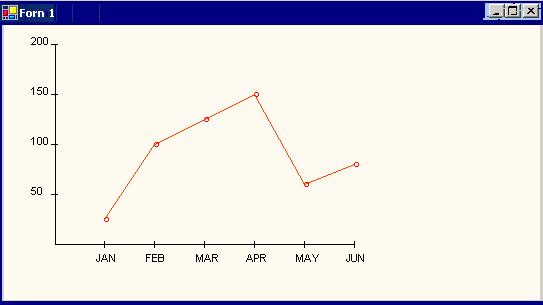
My objective is to display a line graph for the statistics on sales history, sales forecast, percentage of utilization for a resource … etc., for the year/quarter/six months based on hashtable values set from the WinForm during runtime. The user can set the X & Y axis scale during the design time. The X axis scale is designed to hold the scale by month wise for the first quarter, second quarter, third quarter, fourth quarter, first six months, last six months & year. The Y axis scale is designed to hold the growth rate based on the ranges from 0-100 [multiples of 10], 0-200 [multiples of 50], 0-200 [multiples of 25]. The below is the code that lists the enumeration constants in the property window for the component.
public enum XAxisScale {
 FirstQuarter = 0,
 SecondQuarter = 1,
 ThirdQuarter = 2,
 FourthQuarter=3,
 FirstSixMonths=4,
 SecondSixMonths=5,
 Year=6 }

public XAxisScale xAxisDrawingScale;
    public XAxisScale XAxisScaleStyle
    {
      get { return xAxisDrawingScale;}
      set { xAxisDrawingScale=value; }
    }
You can download the source code from the link provided above. Just drag and drop the component in your form and then set its X [XAxisScaleStyle] and Y [YAxisScaleStyle] axis scale using the enum listed in the property window as a drop down. After setting the scale, set the hash table values as provided below to the xValues property. That’s it. Have fun.
Hashtable hTable = new Hashtable();

hTable.Add("JAN","25");
hTable.Add("fEB","100");
hTable.Add("MAR","125");
hTable.Add("APR","150");
hTable.Add("MAY","60");
hTable.Add("JUN","80");
hTable.Add("JUL","90");
hTable.Add("AUG","75");
hTable.Add("SEP","40");
hTable.Add("OCT","30");
hTable.Add("NOV","85");
hTable.Add("DEC","110");

lineGraph1.XValues=hTable;
This member has not yet provided a Biography. Assume it's interesting and varied, and probably something to do with programming.


 General
  News
News  Suggestion
  Question
  Bug
Bug  Answer
  Joke
Joke  Praise
  Rant
Rant  Admin
Admin 


