Introduction
This article will take you through code on how to create an interactive bar chart with D3.js.
For taking advantage of this article you need to have fair knowledge of HTML, JQuery, SVG and basic knowledge of D3.js. For D3 basics you can visit my previous article - D-js-Getting-Started .
As a server side technology, I have used ASP.Net MVC 4.0, However, it will make no difference if you want to use any other server side technology as D3.js is a client side technology and server side technology only serves purpose of sending data to client side which will be processed by D3.Js.
Data
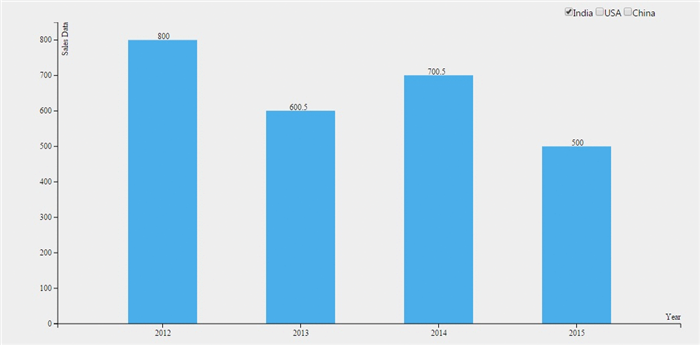
For our example, we have taken dummy data of a company which have branches in many regions in world, say – USA, India and China. Our application will show bar chart for sale in these regions. This bar chart will be interactive such that user can choose region of his choice to see the data for.
| Region | Year | Sale($) |
| USA | 2012 | 700 |
| USA | 2013 | 600 |
| USA | 2014 | 750.5 |
| USA | 2015 | 400 |
| India | 2012 | 800 |
| India | 2013 | 600.5 |
| India | 2014 | 700.5 |
| India | 2015 | 500 |
| China | 2012 | 900 |
| China | 2013 | 700.5 |
| China | 2014 | 800.5 |
| China | 2015 | 500 |
Final output will be something like this -
Code
For D3.js, you need to to have reference of JQuery(download from here) and D3Js(download from here). Alternatively, you can take reference from CDN directly also.
Define height, width and margins of your chart
var yearData;
var salesData;
var chart;
var data;
var margin = { top: 20, right: 30, bottom: 30, left: 40 },
width = 1000 - margin.left - margin.right,
height = 500 - margin.top - margin.bottom;
Now first, we will get the data from AJAX request. As you need to provide user a way to provide input. For this, I had created dynamic checkboxes depending upon the data for regions we are getting from server.
Second, we will initiate our chart object which will be a placeholder for our chart.
Third, we will keep all our logic to build bars of our chart in a function. Let’s name it as BuildBars (). This function will be explained later in the article.
function Plot(index) {
d3.json("/Home/SalesData", function (error, d) {
data = d;
var controlHTML;
controlHTML = '<div class="SearchToolDiv" id ="SearchOptionDiv" style="float: right;"><span class="SearchToolSpan" id="searchTool"><table class="formtable" style="table-layout: fixed;"><tbody><tr><td>';
for (var i = 0; i < data.length; i++) {
controlHTML = controlHTML + '<input type="checkbox" onclick="BuildBars(' + i + ',this)"';
if (i == index) {
controlHTML = controlHTML + ' checked ';
}
controlHTML = controlHTML + '><span style="display:inline !important; color:black">' + data[i].CountryName + ' </span>';
}
controlHTML = controlHTML + '</td></tr></tbody></table></span></div>'
$(controlHTML).appendTo($("#chart"));
chart = d3.select("#chart")
.append("svg")
.attr("width", width + (2 * margin.left) + margin.right)
.attr("height", height + margin.top + margin.bottom);
BuildBars(index,null);
});
}
Now, you have initiated your chart, defined your drawing area (height and width) and got the basic data to draw your chart so we can proceed to build bars which can represent our data. First, your data may not be in form to be able to use for building chart efficiently so you may need to transform your data into usable form. I have used two simple functions to perform this task.
function GetYearsForCountries(countryData) {
    var result = [];

    for (var i in countryData)
        result.push(countryData[i].Year);

    return result;
}

function GetSalesForCountries(countryData) {
    var result = [];
    var max = 0.0;
    result.push(max);
    for (var i in countryData) {
        if (max < countryData[i].SaleRevenue) {
            max = countryData[i].SaleRevenue
        }
    }
    result.push(max + 50);

    return result;
}
Now, let’s code our function BuildBars (). This function will take 2 arguments – index of data array and check box which user has clicked. In this function, first, I will transform data which I got from server into usable objects for my chart.
yearData = GetYearsForCountries(data[index].Sales)
salesData = GetSalesForCountries(data[index].Sales)
Now we can create scales for our charts. X-scale will be ordinal scale and Y-scale will be linear. D3 scales are explained in my previous article - D-js-Getting-Started.
var x = d3.scale.ordinal().domain(yearData).rangeRoundBands([0, width], .5);
var y = d3.scale.linear().domain(salesData).range([height, 0]);
var xAxis = d3.svg.axis()
.scale(x)
.orient("bottom").ticks(yearData.length);
var yAxis = d3.svg.axis()
.scale(y)
.orient("left").ticks(10);
Next, we can bind our data with bars, so that length of bars can change once data changes.
var bar = chart.selectAll("g")
.data(data[index].Sales)
.enter()
.append("g")
.attr("transform", function (d) {
return "translate(" + x(d.Year) + ", 0)";
});
bar.append("rect")
.attr("y", function (d) {
return y(d.SaleRevenue);
})
.attr("x", function (d) {
return (margin.left);
})
.attr("height", function (d) {
return height - y(d.SaleRevenue);
})
.attr("width", x.rangeBand());
Write data values as text over your rectangles
bar.append("text")
    .attr("x", x.rangeBand() / 2 + margin.left + 10)
    .attr("y", function (d) { return y(d.SaleRevenue) - 10; })
    .attr("dy", ".75em")
    .text(function (d) { return d.SaleRevenue; });
Write text in x-axis and y-axis for information these axes are representing.
chart.append("g")
    .attr("class", "x axis")
    .attr("transform", "translate(" + margin.left + "," + height + ")")
    .call(xAxis)
.append("text")
    .attr("x", width)
    .attr("y", -6)
.style("text-anchor", "end")
    .text("Year");

chart.append("g")
    .attr("class", "y axis")
    .attr("transform", "translate(" + margin.left + ",0)")
    .call(yAxis)
    .append("text")
    .attr("transform", "rotate(-90)")
    .attr("y", 6)
    .attr("dy", ".71em")
    .style("text-anchor", "end")
    .text("Sales Data");
Lets now decorate our page with some CSS and we should be ready to run code.
<style type="text/css">
    #chart rect{
      fill: #4aaeea;
    }

    #chart text{
      fill: black;
      font: 12px sans-serif bold;
      text-anchor: end;
    }

    .axis text{
      font: 12px sans-serif  bold;
    }

    .axis path, .axis line{
      stroke :black;
      fill: none;
    }

    body{
      background: #1a1a1a;
      color : #eaeaea;
      padding : 10px;
    }
</style>
Points of Interest
D3.js is a powerful data visualization technology which quickly gaining interest of many data visualization engineers. You can almost draw any kind of charts with it.
While I avoided creating fancy structures while writing code but this article can certainly be treated as starting point to create intractive bar charts.
Gained more than 10 years of experience as a software professional while working in different technologies like C#,JQuery,ASP.Net, ASP.Net MVC, SQL Server, Cloud computing, SSRS and Crystal Reports.
Straight talking, focused and still a student. I love perfection and believe in gradual improvement.


 General
  News
News  Suggestion
  Question
  Bug
Bug  Answer
  Joke
Joke  Praise
  Rant
Rant  Admin
Admin 


