In the process of digging deeper into WPT I did find many new ways to explore my system. The Windows Performance Toolkit for Windows 8 is NOT only for Windows 8 but it does run on Windows Vista and later. This toolkit is the the Hubble Space Telescope of performance engineering. It gives you call stacks far far away in the kernel and back across all processes of your system. But it is not only a tool for kernel hackers. You can use it also as an easy and free batch script profiler. It does not matter what you use (cmd,
PowerShell, Perl, ..) as long as your main work of the script does consist of calling one process after another.
When you want to install the Windows Performance Toolkit you get more infos here.
To start profiling your system you only need to execute 4 steps.
- Open a command prompt and do cd “C:\Program Files\Windows Kits\8.0\Windows Performance Toolkit”
- Now type xperf -on PROC_THREAD
- Execute your script
- Stop profiling and save the trace file to the
default location: xperf –stop
- View the profiling information: wpa c:\kernel.etl
To show how the trace file does look like I have started several
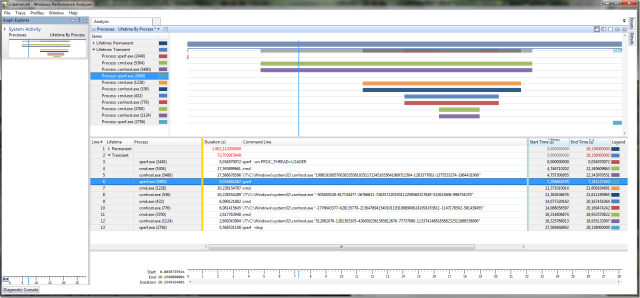
cmd.exe processes and stopped them to have something to graph. When I view the trace file with wpa.exe I do get this:

The graph shows on the x axis the time in seconds since you did start recording the trace. Every process start and stop with full command line information is recorded. The y-axis does contain the started processes so you can follow the timeline of your script and you can directly see which process has the longest bar which might be worth optimizing. I do show you this with xperf since for this very useful graph you do need to enable only the PROC_THREAD kernel provider. A list of the most useful providers is documented here. This allows you to capture long traces with very small trace files (about 1MB/min). WPA can handle trace files with decent performance up to 1GB. The other recording tools of WPT are WPR and the gui WPRUI which do enable myriads of kernel providers which logs trace data with a rate of ca. 1 GB/min on a busy system. That is not a suitable setup for taking data for some hours or even minutes.
It was never so easy to to benchmark your scripts as it is with WPT. The “old” xperf tool can do this stuff since many years but it was only known to driver developers. If you want to capture ETW events on a customer machine you do not need to install WPT on them for simple tasks. You can capture and save traces with
logman.exe as well.
- Start Profiling: logman create trace -ets "NT Kernel Logger" -o kernel_logman.etl -p "Windows Kernel Trace" (process)
- Stop Profiling: logman stop -ets "NT Kernel Logger"
- View Captured Data: wpa kernel_logman.etl
This is the equivalent to our previous XPerf call. There seem to be many aliases built in into the tools which makes it a bit hard to find out what options I do actually need. But hey it does work. If you search for logman in your favorite search engine there are surprisingly few hits. It is time to change that. If it is so easy to profile your
batch scripts these things should get more attention.
He is working for a multi national company which is a hard and software vendor of medical equipment. Currently he is located in Germany and enjoys living in general. Although he finds pretty much everything interesting he pays special attention to .NET software development, software architecture and nuclear physics. To complete the picture he likes hiking in the mountains and collecting crystals.


