
Profiling of C++-Applications in Visual Studio for Free
4.97/5 (48 votes)
A method for profiling C++-applications with freely available tools (vsperfcmd, vsperfreport, and a C#-application for viewing the results)
Introduction
While the Team- or Premium-editions of Visual Studio contain a profiler, users of e.g. the professional edition are lacking such a feature. In this article, I present a method for profiling C++-applications with freely available tools and a simple application for presenting the results in an informative view.
Of course, the resulting solution will not be as comfortable as an integrated profiler, but if you use profiling only when you find bottlenecks, this method is certainly sufficient - and €5.000 cheaper.
The following method was tested with Visual Studio 2008 Professional and Visual C++ 2010 Express.
The Method
The method consists of four steps:
- Generate a special "/PROFILE" build using Visual Studio (all editions can do this).
- Profile the freshly compiled application with the freely available Microsoft tool "VSPerfCmd".
- Convert the resulting .vsp-file to .csv-files using "
VSPerfReport". - Analyze the resulting - huge - csv-files with the attached Profile Result Viewer.
Generate a /PROFILE-build
Note: The following steps should of course be done with a release build and with debugging symbols enabled.
In Visual Studio 2008, go to the solution explorer, select the project and open the properties page. In the section, "Configuration Properties", choose "Linker" - "Advanced".
Set "Profile" to "Enable Profiling information (/PROFILE)" (the exact steps for other versions of Visual Studio might differ).

Compile the project.
Generate a Profile Report (vsp)
First of all, install the Visual Studio Performance Tools. The Visual Studio 2008 Service Pack 1 Stand-Alone Profiler can be found at this link.The generation of the report requires to enter a handful of commands in the command line.
Preparations in the Commandline
Open the command prompt. Define a shortcut to the performance tools and switch to the folder, your application is located in:
set pt="C:\Program Files\Microsoft Visual Studio 9.0\Team Tools\Performance Tools"
cd [my_app_folder]
Profiling a Full Application Run
The simplest method is to profile the full uptime of the application.
:: Start the profiler
%pt%\vsperfcmd /start:sample /output:my_sampled_data.vsp

:: Launch the application via the profiler
%pt%\vsperfcmd /launch:my_app.exe

:: Shut down the profiler (this command waits, until the application is terminated)
%pt%\vsperfcmd /shutdown
Profiling only part of the application Uptime
It is also possible, to profile only part of the application uptime.
Here the handling becomes a bit tedious, so I suppose it would be best to implement some simple app to automize the following steps. Anyways, I never really had the demand for profiling only part of the uptime, since I could (maybe by modifying the application's startup code) always come up with code, that spent 90% of its time in the relevant part. Nevertheless, if you cannot modify your code adequately, here are the additional steps.
Start vsperfcmd as above and attach it to your application afterwards:
:: Start the profiler
%pt%\vsperfcmd /start:sample /output:my_sampled_data.vsp

:: Send the profiler to a waiting state
%pt%\vsperfcmd /globaloff

:: Attach to your application by specifying the pid
%pt%\vsperfcmd /attach:[pid]
After attaching to your application, perform whatever preparation is necessary. Now initiate the function that you want to profile and activate the profiler.
:: Activate the profiler
%pt%\vsperfcmd /globalon
When the function is finished (or you think enough time has passed), stop profiling:
:: Detach the profiler from your application
%pt%\vsperfcmd /detach

:: Shut down the profiler
%pt%\vsperfcmd /shutdown
Convert the Profile Report to a csv-file
The tool vsperfreport loads symbol-files (.pdb) and merges them with the generated report (.vsp) to create .csv-Files.
:: generate the report files (.csv)
%pt%\vsperfreport /summary:all my_sampled_data.vsp
If you are also interested in calls within system files, you can also specify a path to a symbol server or a local cache.
%pt%\vsperfreport /summary:all my_sampled_data.vsp
/symbolpath:"srv*C:\MySymbolCache*http://msdl.microsoft.com/download/symbols"
View the Report
The csv-files above can in principle be opened with any spreadsheet application, nonetheless, they are typically huge, and not immediately helpful.
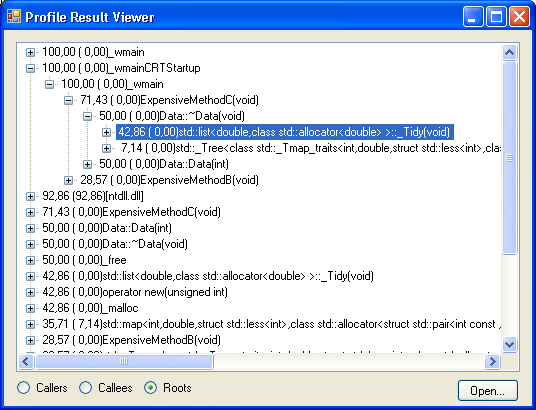
Therefore, I wrote a small application that parses one of the generated files (the one named "...CallerCalleeSummary.csv") and presents it as a tree view, ordered by total percentage. Starting from this view, it should be easy to find the cause for performance problems. For my part, I could uncover several bottlenecks in C++-legacy code, which I would never have found, just by looking at the code.
Using the Code
Attached is also a small C++-application for which I generated a profile. The generated .vsp and .csv-files are contained in the "Release"-subfolder. Opening "my_sampled_data_CallerCalleeSummary.csv" with ProfileResultViewer should resemble the screenshot I have given above.
Points of Interest
- The profile report will show statistics only for functions, not for individual lines.
- Functions that are inlined will not be contained in the profile, since they also never appear in the native call stack.
- The presented
treeviewis not strictly hierarchic: If A calls B, then in the presented view B might seem to require more time than A. This appears, because total percentages are shown, i.e., it is not shown how much time B took, when it was called from A, but how much time B took in total. I am not sure if the csv-files contain enough information to recover the more detailed figures.
Of course, some of the steps above could be easily integrated into some GUI-Application, but for the moment the procedure I described above is sufficiently simple for me.
History
- 11.01.2011: Initial version
- 11.07.2012: Improved speed of ProfileResultViewer for large CSV-files (thanks to SteelixB for giving me the hint)