
Windows Charting Application
4.84/5 (37 votes)
Windows Charting Application to generate charts using the Microsoft charting control and save the chart image as a file
Introduction
I was asked to create a charting webpart in the Sharepoint project that I was working in my company. I spent quite a bit of time in collecting knowledge base to develop the webpart. Finally, I took the help of Microsoft charting controls for Visual Studio 2008 to achieve this.
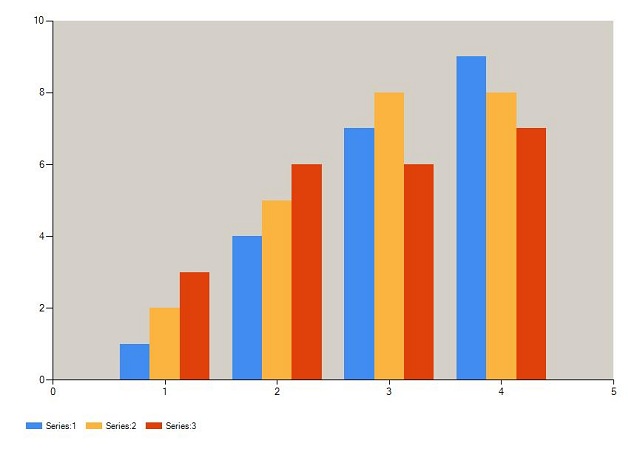
To share the knowledge that I gained, I created a Windows application to generate charts of various types which you can select from a combo box.
As I got the knowledge base in charting from various different sources, I would like to put them all together in a single place in a widely use developers site like CodeProject. You can learn about the Chart class in the namespace System.Windows.Forms.DataVisualization.Charting and how to use it to generate chart at run-time. Also, you can see how to get the enum names collection and load it to a container. In this application, the system KnownColor enum names are loaded to a combo box to set the form and chart area color from the UI which seems interesting.
Hope this helps somebody for charting controls.
Background
The assembly System.Windows.Forms.DataVisualization.dll and System.Web.DataVisualization.dll do a great job in creating charting controls for Windows and web applications.
Namespaces
System.Windows.Forms.DataVisualization.Charting(For Windows)System.Web.UI.DataVisualization.Charting(For Web)
Provide the Chart Class to create charting control as required. You can download and install the Microsoft charting controls assemblies here.
Using the Code
The best way to use the code is to download this project and view the code files straight away. Understand the concepts and create your own charting controls. I promise it is very simple and handy to do this.
The class WindowsCharting creates and returns the charting control. Below is the class source code:
 sealed class WindowsCharting
    {
        //method generates the chart
        #pragma warning disable 0628
        protected internal Chart GenerateChart
	(DataTable dtChartDataSource, int width,int height,string bgColor,int intType )
        {
            Chart chart = new Chart()
            {
                Width = width,
                Height = height
            };
            chart.Legends.Add(new Legend(){Name = "Legend"});
            chart.Legends[0].Docking = Docking.Bottom;
            ChartArea chartArea = new ChartArea() { Name = "ChartArea" };
            //Remove X-axis grid lines
            chartArea.AxisX.MajorGrid.LineWidth = 0;
            //Remove Y-axis grid lines
            chartArea.AxisY.MajorGrid.LineWidth = 0;
            //Chart Area Back Color
            chartArea.BackColor = Color.FromName(bgColor);
            chart.ChartAreas.Add(chartArea);
            chart.Palette = ChartColorPalette.BrightPastel;
            string series = string.Empty;
            //create series and add data points to the series
            if (dtChartDataSource != null)
            {
                foreach (DataColumn dc in dtChartDataSource.Columns)
                {
                    //a series to the chart
                    if (chart.Series.FindByName(dc.ColumnName) == null)
                    {
                        series = dc.ColumnName;
                        chart.Series.Add(series);
                        chart.Series[series].ChartType = (SeriesChartType)intType;
                    }
                    //Add data points to the series
                    foreach (DataRow dr in dtChartDataSource.Rows)
                    {
                        double dataPoint = 0;
                        double.TryParse(dr[dc.ColumnName].ToString(), out dataPoint);
                        DataPoint objDataPoint = new DataPoint()
		       { AxisLabel = "series", YValues = new double[] { dataPoint } };
                        chart.Series[series].Points.Add(dataPoint);
                    }
                }
            }
            return chart;
        }
    }
In my sealed class, you could see the #pragma over the protected member that generates the chart. This is used to suppress the incorrect and famous warning message "new protected member declared in sealed class". First, I wonder how I got this warning message when as my protected member doesn't override other member. As this warning is irrelevant here, it has been suppressed using the #pragma warning disable 0628. The class member:
protected internal Chart GenerateChart
(DataTable dtChartDataSource, int width,int height,string bgColor,int intType)
{
//Code
}
creates an instance for the Chart class and sets the instance properties and adds the required ChartArea and Legend to the collections ChartAreas and Legends. Set the Chart gridarea X and Y axes lines width as below:
//Remove X-axis grid lines
chartArea.AxisX.MajorGrid.LineWidth = 0;
//Remove Y-axis grid lines
chartArea.AxisY.MajorGrid.LineWidth = 0;
The datatable serves the datapoints to plot the chart. A Series is a parameter for which we need the chart and a datapoint is the actual chart plotting points for the respective X and Y co-ordinates.
Adding duplicate Chart Series to a ChartArea returns:
System.Argument
exception. I have looped the DataTable to create the DataPoint instance for the Chart Series. You have options to set the DataSource for the chart and the DataPoint member field as well. You can then set the XValueMemeber field or column for X-Axis and YValueMember field or column for Y-Axis datapoint.
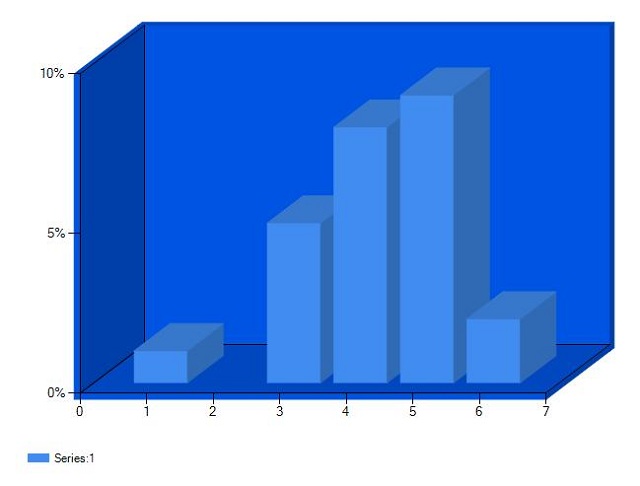
The chart X and Y axis labels could be formatted for %, currency("c") etc. using the LabelStyle.Format property. For example, here is the code snipped to have percent(%) in the Y-Axis labels:
chartArea.AxisY.LabelStyle.Format = "{0;0}" + "%";
and the Y-Axis labels looks as follows:
In this Windows application, you can also set the form and chart area colors through the UI. Chart is viewable in different types available in the enumeration SeriesChartType:
//Load system knowcolors list to the combo
        private void LoadColors(ComboBox cboControl)
        {
            var systemColors = Enum.GetNames(typeof(KnownColor));
            foreach (string color in systemColors)
            {
                cboControl.Items.Add(color);
            }
            cboControl.SelectedIndex = cboControl.SelectedIndex <= 0 ?
				1 : cboControl.SelectedIndex;
        }
        //Load chart types list to the combo
        private void LoadChartTypes(ComboBox cboControl)
        {
            var chartTypes = Enum.GetNames(typeof(SeriesChartType));
            foreach (string type in chartTypes)
            {
                cboControl.Items.Add(type);
            }
            cboControl.SelectedIndex = cboControl.SelectedIndex <= 0 ?
		(int)SeriesChartType.Column : cboControl.SelectedIndex;
        }
Get the system KnownColor enum names:
var systemColors = Enum.GetNames(typeof(KnownColor));
The variable systemColors is of type string[] that contains KnowColor enum names.
The class Chart has huge number of properties and members to configure.
The chart viewable in 3D:
chart.ChartAreas[0].Area3DStyle.Enable3D = true;

Generate the chart Save As type filters for the SaveFileDialog to the names in ChartImageFormat enum:
var chartImgFormats = Enum.GetNames(typeof(ChartImageFormat));
string filter = string.Empty;
foreach (string format in chartImgFormats)
{
        filter += format + "(*." + format + ")|*." + format + "|";
}
filter += "All files (*.*)|*.*";
saveFileDialog.Filter = filter;
Points of Interest
- Generating the chart at runtime
- Changing the look and feel at run-time for the system
KnowColor
Conclusion
Hope you all enjoy the application and the source code is useful for those who are in need of them.
Please vote for the article if you find it useful.