
Simple Column Chart Generator
4.79/5 (13 votes)
With this library, it’s possible to generate some column chart images easily
Introduction
This article shows how to generate some column chart images for your users in an easy way. You can simply give some arguments to the class library and receive an image object, or directly save it on hard disk.
An example application will be shown in this article, how to use the class library, the features implemented and the future enhancements. The image below is an example of column chart created using this class library.

Building a library like this is not such an easy task, because the number of calcs you have to do to render the image grow up faster by the way you add new features. Making a library with just a few features also doesn’t make sense, because you'll probably have to re-implement it again everytime you need to use it.
If you search on the Web, it is easy to find some good (great) chart generator libraries. For most of them, you have to pay if you want to use without having access to source code.
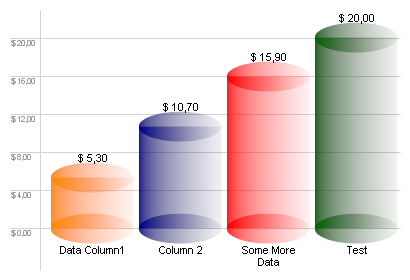
The goal of this article is to share knowledge and give developers an alternative to create some simple column chart images. The image below is another example:
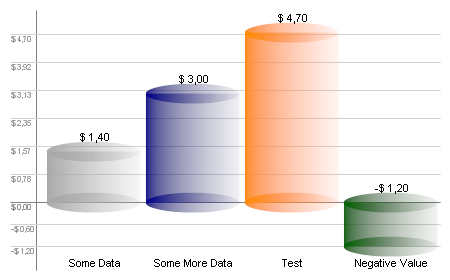
The image below is a chart example using negative values:
The Demo Application
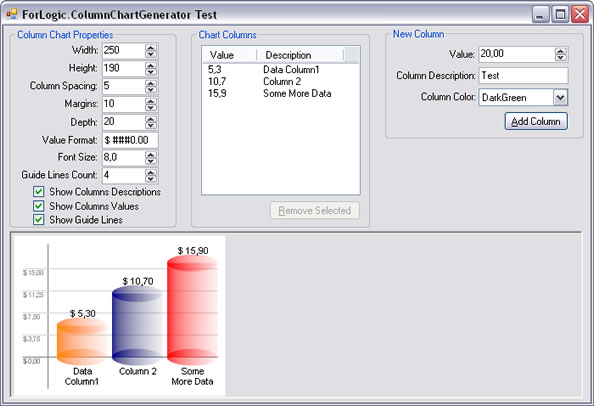
To easily understand the features of this library, I have developed a demo application that looks like the image below:
With this demo application, we can give some arguments to the engine and the image will be rendered just below (as you can see on the image). It’s important to say here that not all the features and possibilities are available in this demo application.
Inside the first group named “Column Chart Properties”, we have the general chart properties, like image width, height, margins, etc. The second and third groups are related to the column values and descriptions. Through these groups, you can remove and add new columns to the chart. Try it!
Library Features – How To Use Them!
To make this project most flexible, you can format the chart your way. There are lots of combinations you can create, giving the charts other appearances. Here, I'll enumerate some properties of the chart you can access and change. Most of these properties are self-explained.
Chart Properties
- Width
- Height
- Image Background Color
- Column Spacing
- Margins
- Depth
- Value Format
- Value Font (family, size and style)
- Description Font (family, size and style)
- Show Columns Values
- Show Columns Descriptions
- Show Guide Lines
- Guide Lines Line Width
- Guide Lines Font (family, size and style)
- Guide Lines Values Format
- Guide Lines Color
- Guide Lines Text Color
- Guide Lines Count
- XY Line Color
- XY Line Width
- XY Text Color
We can create an instance of the chart object with just this code:
ColumnChart chart = new ColumnChart();
chart.Width = 250;
chart.Height = 220;
Now, we'll have to add some columns. Below are the column properties.
Columns Properties
- Fill Color
- Value
- Description
There are two ways to add columns. The first is by directly using the Add method, adding new columns to the collection. The second way is passing a DataTable object to the SetDataSource method.
First Way
ColumnChartItem item1 = new ColumnChartItem(Color.DarkBlue, “any description”, 12);
ColumnChartItem item2 = new ColumnChartItem(Color.DarkOrange, “test”, 15);
ColumnChartItem item3 = new ColumnChartItem(Color.DarkGreen, “description”, 10);
chart.Items.Add(item1);
chart.Items.Add(item2);
chart.Items.Add(item3);
Second Way
chart.SetDataSource(datatable, "valueColumn", "descriptionColumn");
Future Enhancements
Actually, it’s not possible to group data columns. It’s a limitation of this version.
Also, it would be great if we have other types of charts like line charts, pie charts, bar charts, etc.
Conclusion
This is a limited alternative to generate column charts, but can be used on simple tasks. It’s possible to share some knowledge with this little project, explaining how to use the library and giving access to the source code.
History
- [26/Jan/2008] Bug fix and new features
- Bug fix:
System.DivideByZeroExceptionreported by Vertexwahn - New feature 1: Added property
GuideLinesCount - New feature 2: It's possible to add negative value columns
- Bug fix:
- [18/Jan/2008] Original version posted