
What can SmartLabels™ Technology do for me?
4.35/5 (7 votes)
By Andrew Bryan, Product Manager, Dundas Data Visualization Inc.
Introduction
Dundas Data Visualization has many powerful features built into Dundas Chart for .NET. One feature, SmartLabels™, allows for a less-cluttered display of data points for a chart to look the way you need.
SmartLabels™ uses a rule-based technology to get collision-free data point labels. Label collisions can occur when there are many points on a chart or when there are points of similar values. Handling this is one of the most difficult tasks any chart can face and it usually fails to meet the human expectation of the chart appearance. In the end, most chart developers will position the labels manually, which may reduce the collisions but will fail in unknown data conditions. This is where Dundas Chart for .NET excels.
Dundas Chart for .NET SmartLabels™ is designed to prevent data point label collisions for most chart types. Figure 1 shows a simple Line-Column chart where each data point displays a value label. This case shows a simple case and is not uncommon in everyday charting. There is not a large number of points. However, they are similar in value. Notice there are several point labels overlapping and two extending outside of the charting area. The trend is obvious to the eye and the Y-axis labels help understand the data, but the overlapping makes the chart difficult to read.

Figure 1: Chart without SmartLabels™
By enabling each series with SmartLabels™ technology, a messy, unreadable chart can quickly become one that allows you to visualize your data.
// Enable SmartLabels for each series


foreach(Series series in Chart1.Series)

    series.SmartLabels.Enabled = true;
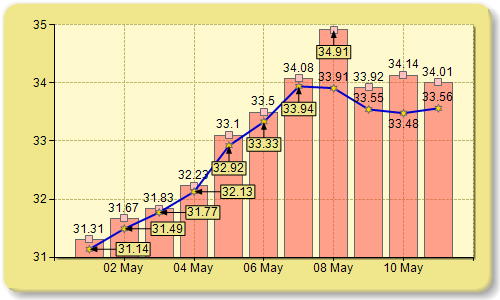
Figure 2: Chart with SmartLabels™
With SmartLabels™ there is no complex algorithm for you to write and you don't need to know anything about the data ranges beforehand. SmartLabels™ just works with little a very limited time investment to produce clean and readable charts.
How to Use SmartLabels™
When using SmartLabels™ you have control over the appearance styling. There are also two categories of SmartLabels™ rules: label movement rules and positioning rules. Let's take a closer look at the properties each category provides.
Appearance Styles
When a data point label is moved far enough away from a data point, a Callout Line may be shown to the point. The property, LabelCalloutStyle, determines how a Callout Line is terminated at the label end of the line. The possible styles for termination end are a Box, an Underline or None (no added styles). Setting the style is simply one line of code.
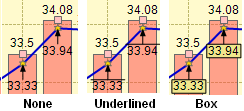
Figure 3: Available Callout Styles
// set the callout style to show a box


Chart1.Series["Series1"].SmartLabels.CalloutStyle = LabelCalloutStyle.Box;
There are other style properties that provide control of the appearance of the Callout Line, as well as the inside color of the box (when the LabelCalloutStyle is of a Box type).
// set the callout box back color
Chart1.Series["Series1"].SmartLabels.SmartLabelEndCap = LabelEndCap.Arrow;

// set the callout box back color
Chart1.Series["Series1"].SmartLabels.CalloutBackColor = Color.Khaki;

// set the callout line color
Chart1.Series["Series1"].SmartLabels.CalloutLineColor = Color.Black;

// set the callout to be a solid line
Chart1.Series["Series1"].SmartLabels.CalloutLineStyle = ChartDashStyle.Solid;

// set the callout line width of 1 pixel
Chart1.Series["Series1"].SmartLabels.CalloutLineWidth = 1;
Movement Rules
The movement rules are the real guts of Dundas Chart for .NET SmartLabels™. They are simple to understand and set the stage for the readable charts. For example, if it has been determined that a label must be moved, the SmartLabel movement rules permit you to specify the moving distances, the allowable moving directions and whether the label is able to exist outside of the plotting area. These are controlled through the use of several moving-related properties. The default movement rules will normally resolve most issues. However, as usual, Dundas Chart for .NET provides developers with significant customization tools, and SmartLabels™ are no exception.
The allowable data point label movement direction is set using the MovingDirections property. This property can be set to a single direction or as a bitwise OR combination to give you complete control of the movement direction. The distance of movement can also be controlled using the MinMovingDistance or MaxMovingDistance properties. These are pixel properties which define a value that specifies the minimum or maximum distance from the data point that data point labels are allowed to be moved. When a data point label needs to be repositioned, the label will be moved by the range of pixels specified.
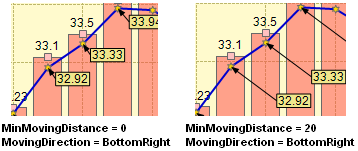
Figure 4: Moving Distance and Direction Behavior
// set the minimum moving distance Chart1.Series["Series1"]
.SmartLabels.MinMovingDistance = 20; // set the maximum
moving distance Chart1.Series["Series1"].SmartLabels.MaxMovingDistance = 30;
// set the allowable label moving directions
Chart1.Series["Series1"].SmartLabels.MovingDirection =
LabelAlignment.Bottom | LabelAlignment.BottomRight;
An additional property, the AllowOutsidePlotArea property, sets a value that specifies the extent of how far outside of the plotting area the labels may go. The default value allows labels to extend partially outside (up to 50%), but can also be set to allow full label drawing outside or not at all. When applying SmartLabels™, the drawing outside of labels is used only to provide an additional option to the chart; the chart will only draw outside if the labels cannot be drawn elsewhere without overlapping.
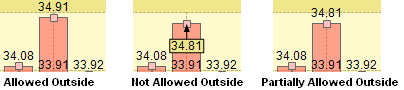
Figure 5: AllowOutdsidePlotArea Behavior
// set the rule for labeling outside the plot area (Yes, No or Partial)
Chart1.Series["Series1"].SmartLabels.AllowOutsidePlotArea =
    LabelOutsidePlotAreaStyle.Partial;
Positioning Rules
Overlapping labels is an obvious condition for when to reposition a label, but there are other conditions such as labels overlapping markers and a rule to hide labels that cannot be repositioned without overlapping elsewhere (without violating the user-defined rules). In the first frame of Figure 6, the markers are permitted to overlap the data point marker. In the second frame, they are not allowed to overlap and, based on the movement rules that were defined for this example, the point label could be placed anywhere else. The result was that the data point label was not drawn at all.
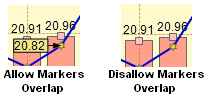
Figure 6: MarkersOverlapping Behavior
// Allow data point labels to overlap data point markers
Chart1.Series["Series1"].SmartLabels.MarkersOverlapping = true;
// Hide all labels that cannot be repositioned without
overlapping Chart1.Series["Series1"].SmartLabels.HideOverlapped = true;
With the API provided and the flexibility of the Dundas Chart for .NET rule-based labeling, unreadable charts need never be shown again!
Want to Know More?
For an interactive demonstration of Dundas Chart for .NET SmartLabels™, download a full evaluation copy of Dundas Chart for .NET Enterprise Edition and experiment with our extensive sample set or visit the Dundas Chart Gallery on our website.