
Beginner Guide to Page and Script Debugging with Chrome
A beginner introduction to the features of the Chrome Debugger
Introduction
As you begin to develop HTML and JavaScript ladden webpages, tracking down bugs becomes an important issue. Identifying them quickly and easily has become a whole lot easier with the features introduced in modern browsers. However, knowing the capabilities of the browser console and what it can do for you is often a mystery. In this article, I hope to shed light on some of the key features and how you can use them to your advantage.
To start with, we will look at the various components of the Chrome Console, and then start to look at how we can identify coding errors, manipulate JavaScript Object, modify the CSS, step through JavaScript code and watch values, rewrite and test JavaScript code on the fly, call methods, and run jQuery calls against the DOM all from within the console.
There are probably still a heap of things I have to learn, but for a beginner, there is more than enough to be getting after! Shall we begin?
Note: At the time of writing, I was using Chrome 14.0.835.202 m, revisions based on 15.0.874.106 m.
Table Of Contents
In this article, the main items we will look at are:
- Invoking the Debugger
- Anatomy of the Debugger Console
- Manipulating the page CSS
- The Debugger Console
- Identifying Code Errors
- Viewing and Editing JavaScript Variables and Methods
- Executing Functions from Console
- Adding Variables and Functions
- Console Messages
- Console Timers
- Breakpoints, Watches and Code Stepping
- Code View Pretty Print
- Resource View
- Network View
- Timeline View
- Profiles View
- Audits View
- Summary
- History
Invoking the Debugger
The first thing we need to do to be able to view and use the debugger is to call it up. As with any modern application, this can be done in a number of ways. The various methods are:
- From Chrome's Tools menu, you can select "JavaScript Console"
- Use the keyboard shortcut, "CTRL+SHIFT+J"
- Right click on the page you want to debug and select "Inspect Element"
The third option is the simplest option and my preferred, not only will this open up the console, but it will select and highlight the element you right clicked on, within the source files displayed in the console, making things a lot easier. This right click method is the one we will use in the next section.
Anatomy of the Debugger Console
To look at the various element of the console, let's inspect The Code Project homepage, so in Chrome, navigate to http://www.codeproject.com/, right click over the "Welcome to The Code Project" and select "Inspect Element" on the popup context menu.
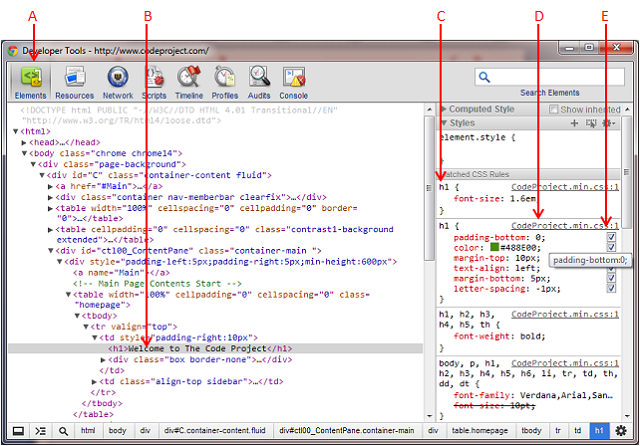
Now, the console will appear, but it may appear either "docked" on the page you are inspecting, or appear as a separate Chrome window. How you like it is up to you, and will probably depend on what you are trying to achieve, but for the purpose of this article, I will be using an "undocked" standalone view. To switch the view, you can use the icon at the bottom left (I) of Figure 1 below:

When you "Inspect Element", the element you were hovering over is selected in the source view, and also highlighted directly on the page you right clicked on. This makes it easy for you to identify elements on the page, relative to their markup on the source. If move your mouse over the source, you will notice that the highlight on the page moves, showing the relationship between the two views.
So what about all the other parts in the image? Moving clockwise from top left, these items are:
- A - Inspected element selection and associated page highlight
- B - Switch between debugger views (we will look into these views later)
- C - Search panel
- D - Properties pane, shows CSS markup value, event listeners, dimension metrics and elements properties
- E - Debugger settings
- F - DOM tree from root to selected element
- G - Page element selection toggle, click icon, then click an element on the page.
- H - Show / hide the JavaScript console
- I - Dock / undock the debugger
We will explore the various views and the JavaScript console in a moment, but first let's look at manipulating the CSS for the page while we have one open.
Manipulating the page CSS
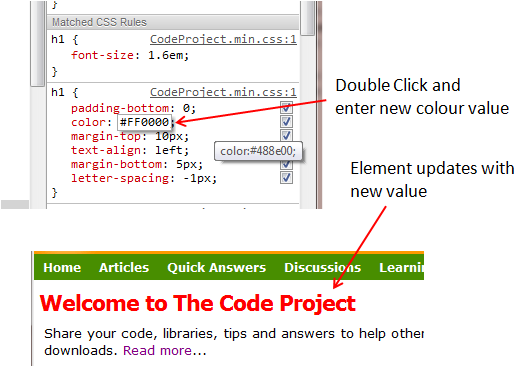
We used the "Welcome to The Code Project" H1 tag to inspect and access the browser. If you have moved off of this element or changed your view, switch back to the "Elements" view (A)(refer Figure 2 below), and click the relevant tag (B). On the right hand side, expand the "Matched CSS Rules" property view and you can see the CSS properties relating to this element (C). If you wanted, you could further drill down to the actual CSS file by clicking on the file name in (D).
Each property has a checkbox appear when the mouse hovers over their CSS rules (E), and you can toggle each property to observe their impact. You may wish to do this if you are trying to determine where a style is being inherited from. In this example, if you uncheck the color property, you would notice that the page immediately updates and the green "Welcome to....." text would switch to black, its default inherited colour for the H1 tag.
Now, what if you are experimenting with styles and colours? It is possible to edit the property names and also change their values. This can be achieved by double clicking either the name of the property or the value of the property. Let us change the "Welcome to...." text to red. For the color property, double click the value and enter #FF0000, hit return and you will see the text turn red. Remember, this is only in memory; refresh the page and the changes are lost!
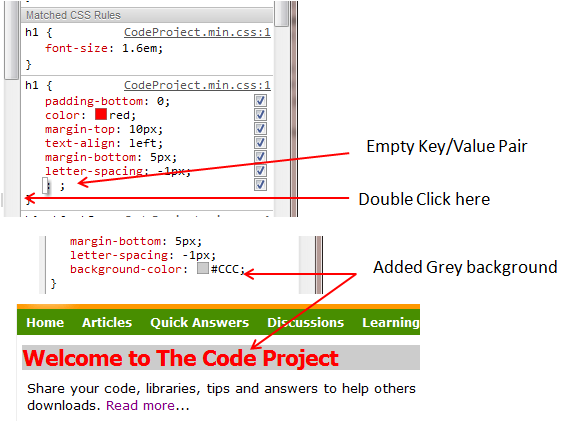
It is also possible to add additional CSS properties to an element. To do this, you double click at the closing brace "}" and a new empty key/value pair will be added. Let us give this "Welcome to...." text a background colour. As you type the property name, the debugger will prompt you with the closest matching valid property name.
The Debugger Console
The debugger console can be used to view error message, display object values, edit object values, execute JavaScript methods, etc. The console can be viewed and hidden by clicking the icon in Figure 1 item (H) (shown bottom left on image below). The "Console" view and its associated controls are shown below:
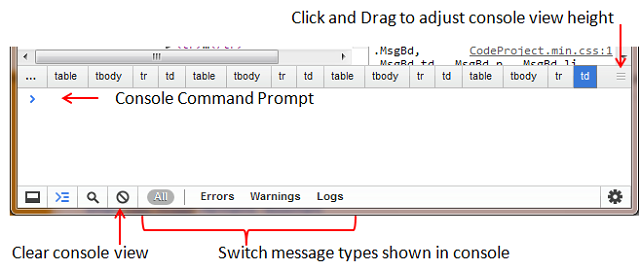
The console can also be shown at the bottom of the main debugger views, i.e., Elements, Resources, Network, Scripts, Timeline, Profiles, Audits. If you click the "Console" view toolbar button (see area item (B) in Figure 1), the console will occupy the full debugger window.
Identifying Code Errors
In this section, we will look at identifying coding errors. To make this easier, I have included some examples in the download. Open up example1.htm, which has a deliberate coding error, and you will see the page shown in Figure 6 below. This page shows two auto updating current Date/Time displays. "Area 1" has the deliberate code bug and therefore does not update, "Area 2" should be updating every second with a new Date/Time stamp.

If we right click over "Area 1" and "Inspect Element", this will open up the debugger. At the bottom right of the debugger, you will see a red icon and a number. This is the number of errors detected. If you show the console, the errors will be listed. At the right of each error message, you will see the file name and line number of each error message (subject to selected filters). If you click the file name, this will show up in the code pane and a banner will be inserted below the error line, containing the error message. This is shown in Figure 7 below:
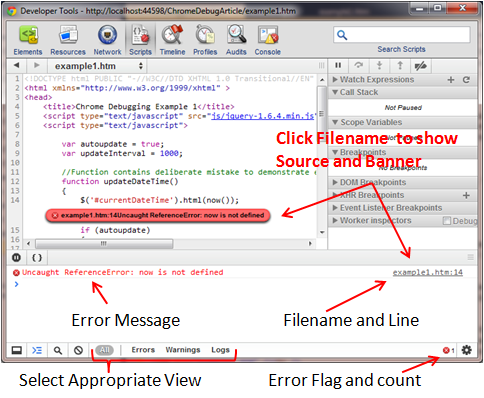
In this example, you will see that we have an "Uncaught ReferenceError: now is not defined", looking at the line immediately above the banner, you can see there is a method now() which is where the problem lies. This is a made up method, which is not defined as part of core JavaScript, or defined in any reference script blocks or source files. Later in this article, we will look at fixing this problem for testing purposes on the fly, without having to open any source editors.
Viewing and Editing JavaScript Variables and Methods
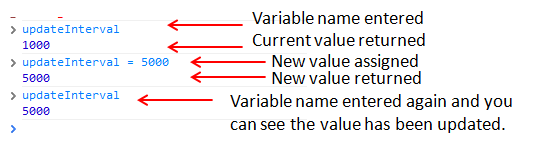
As you can see in the code for this example, there are two variables, autoupdate and updateInterval. In the console, if you type the name of the variable, you will see the current value for it. You can also then set a new value. Let us set the updateInterval to 5 Seconds and reinspect the variable. The variable is used by the setTimeout function, which uses milliseconds (hence 5000).
Simply type the variable name and hit enter to display its current value; assign the new value in the same way. You will also notice that as you type the variable name, Chrome will autocomplete the first matching valid object for what you have typed so far. If it displays the one you want, simple press the right arrow key and Chrome will complete the rest. Handy for long object names. After changing this variable, you should also notice that on the webpage, the "Area 2" is now updating every 5 seconds. The console commands are shown below:
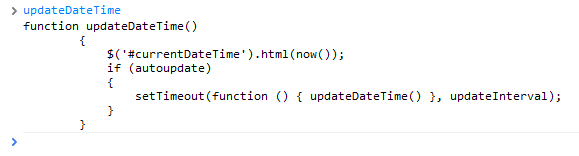
It is also possible to do the same with functions. If we type the name of the faulty function, updateDateTime, this function will be displayed in the console:
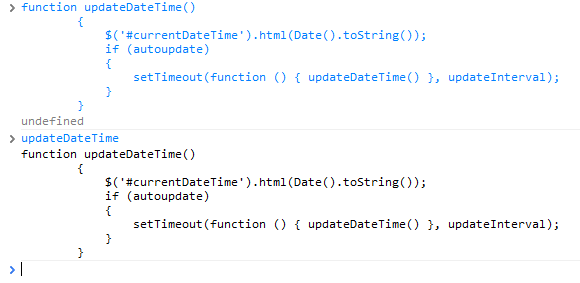
Now, just like variables, you can edit the function. Let's copy and paste the function from the code view into the console, then in the console, remove the text which was the error banner (the error banner text is copied across by Chrome), and replace the invalid now() with Date().toString(). When you enter the updated function, the console should return undefined. NOTE: You cannot enter a new line by using "Enter" key, you must use "Shift + Enter" to add new lines while editing. Re-enter the name of the function, and confirm your changes were accepted.
Now that you have updated the in-memory function, you can test it. We will do this in the next section.
Executing Functions from Console
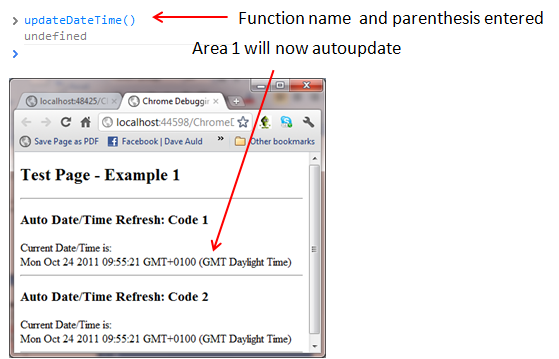
In the previous section, we modified the faulty function, now let's run it. This time in the console, when you type the function name, add parenthesis to the end (). When you hit enter, the function will be executed rather than displayed, and the webpage should start auto updating at the refresh rate. This is shown below:
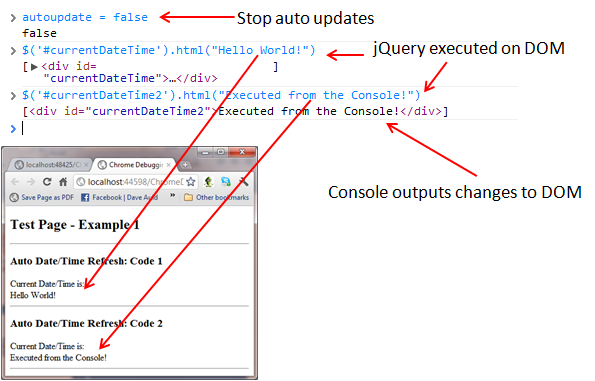
In this example, you will also see that the webpage makes use of jQuery. It is also possible to execute jQuery from the console and update the webpage. In the image below, you will see that we first stop the auto updates by setting the variable autoupdate to false, then execute two jQuery statements:
Adding Variables and Functions
Not only can you edit variables and functions, but during testing you might want to add some. If you close down any active debug consoles and close the Example 1 webpage, this will clear out your in-memory changes. Now, let's re-open Example 1 and get back to a fresh page with the faulty function, and inspect the page to display the console and associated error.
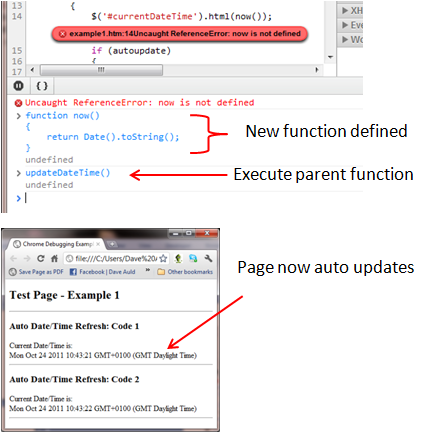
As we know, the function now() is invalid. Let's add it into the in-memory session. In the console windows, simply type the function. NOTE: You cannot enter a new line by using "Enter" key, you must use "Shift + Enter" to add new lines while editing. After you have entered the new function, hit enter to commit. Now, if we execute the updateDateTime() method, you will see that webpage is now updating, demonstrating that your new now() function is working. Variables can be added in the same way as you would define them in an editor, e.g. var name="bob";. The image below shows the new function being added and executed:
Console Messages
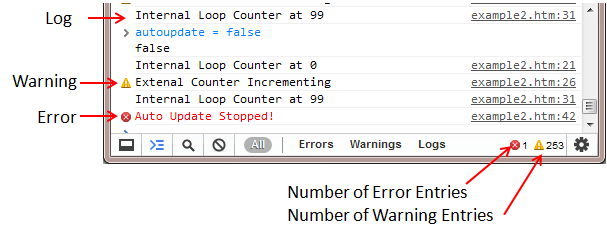
When debugging or developing code, you often want to write message out to the console to see what is going on. As you can see, at the bottom of the console there are three different message filters: Errors, Warnings and Logs. It is possible to write messages directly to these three categories. If we now switch to the another example file I have provided (example2.htm), open it in Chrome, and then switch to the console, you can see these messages being written. If you set the variable autoupdate to false, you will see a console error message trigger. These three entries are shown below:
You can see in the source for the page that the messages are simply generated by one of the three console methods:
console.log("message string");
console.warn("message string");
console.error("message string");
Console Timers
The console also provides methods for performing time monitoring operations. With these, you can start and stop stopwatches to find out, for example, how long a loop takes, or an operation takes to perform a task. The console can run multiple timers, and you simply access these by giving these any identifier you choose. When the timer is stopped, it will output the identifier followed by the duration in milliseconds (ms).
As an example, if you open the console and type the following two statements:
console.time(0)
console.time("Some Timer")
This will create two timers one with the an integer identifier 0, the other with a string identifier "Some Timer".
You simply call the timeEnd(identifier) method to output the elapsed time:
console.timeEnd(0)
0: 12456ms
console.timeEnd("Some Timer")
Some Timer: 23489ms
Using the techniques shown earlier for modifying functions, you could of course inject these calls into the in memory code, or include them in your source mark-up. These methods may help you identify slow running code, and allow you to benchmark improvements in any algorithms you may write.
Breakpoints, Watches and Code Stepping
In this section, we will look at pausing code execution using breakpoints, adding watches and stepping through code. For this section, we will be using the example2.htm file. Close any browser windows and open a fresh copy of the Example 2 page, and invoke the debugger. Your page should be updating the counter and the console messages being logged.
Clicking on the "Scripts" view, you will see the code for the page. Looking through it, you will see that we have two incrementing counters. counter is in the global scope for the page, and x is in the scope of the for loop. As an example, we may be wishing to inspect these variables and step through the code to see when they values are updated allowing us to follow the code logic. In this example, we will use two breakpoints and two watches. So, to start with, let's add the two breakpoints. On the script, click the margin for Line 15 and Line 19. The code will pause and two breakpoints will have been set. This is shown in the image below:
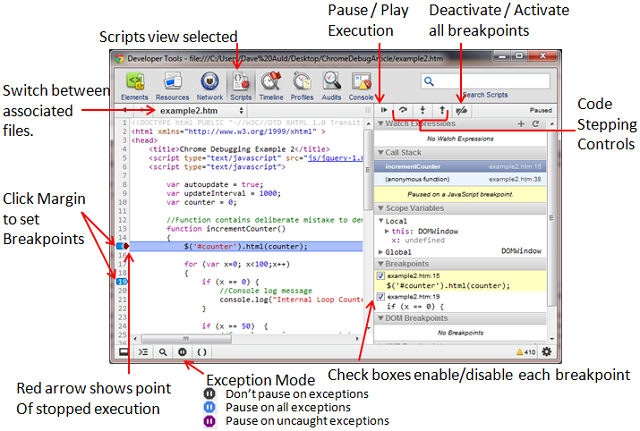
The debugger can also be set to operate in 3 exception modes:
- Don't pause on exceptions
- Pause on all exceptions
- Pause on uncaught exceptions
To change the mode, click the icon as shown at the bottom of the image above.
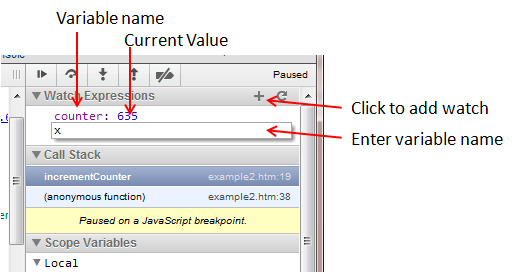
When the code hits a breakpoint, it pauses execution; it is then possible to step through code using the identified stepping controls. You can also now start to inspect values of the variables. Let us add two watches for the variables we want to monitor. To do this, click the "+" in the watch area, and enter the variable names into the field. Hovering over a defined watch will show a "-" sign to the left; clicking it will delete that watch.
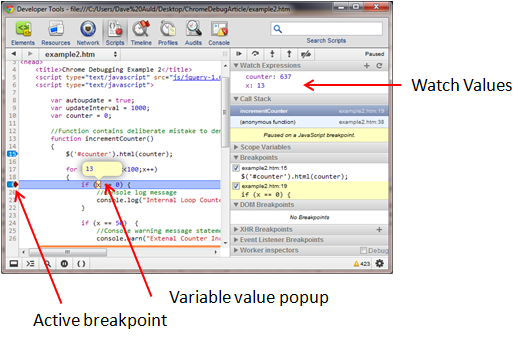
If you then press play to continue execution, as the code hits each breakpoint, the watches will update with the current variable values. If, however, you hit a breakpoint and any of the variables are out of scope, then undefined will be shown. You can also hover over any variable in the code, and a popup will show the current value. This is demonstrated below:
Code View Pretty Print
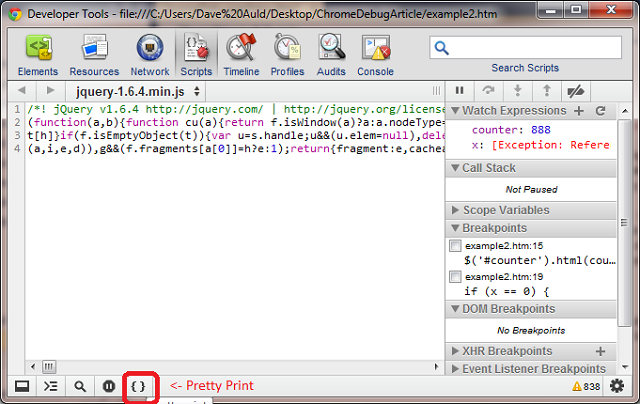
You may find yourself trying to pick through code files that have been minified. All whitespace has been removed and it may appear as a big block of code. With Example 2 loaded in the debugger ("Scripts" view), if you switch to the jQuery file, you will see the minified JavaScript. At the bottom of the code pane, you will see a button with a double brace "{}" (mouse hover shows "Pretty Print"). Clicking this will format the code to a more readable format. The before and after of "Pretty Print" is shown in the following two images:

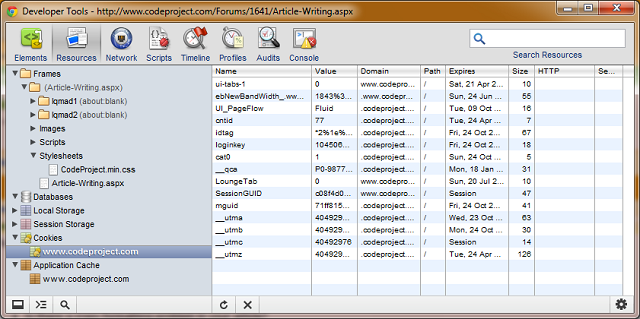
Resource View
The resource view basically shows all resources used by the page. This includes session storage, local storage, cookies, code behind files, image files, etc. It is also possible to delete cookies and individual cookie properties from this view. Using the console, you can also for example add and edit localStorage values. This can be done by localStorage["item name"] = value. Below is a snapshot of the resource view for The Code Project home page:
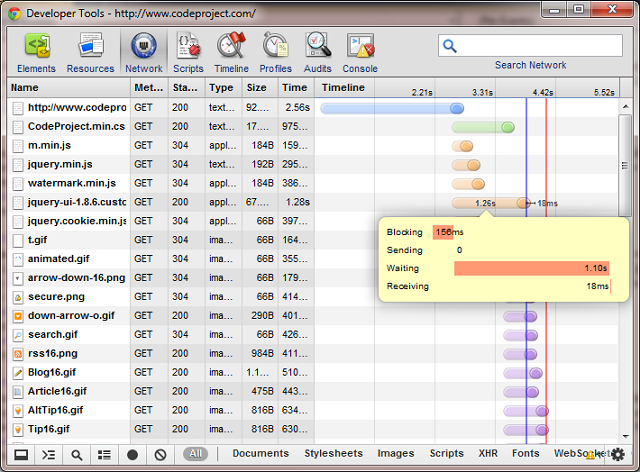
Network View
Have you ever loaded a page and wondered why it sometimes appears to stall as some elements are loaded? With the "Network" view, it is possible to analyze all the network activity, time load resources and the order in which things are occurring. This can help diagnose problems with libraries, images, etc. The image below is a partial capture from loading The Code Project home page. Mouse hovering over the elements on the graph will provide more information. Using the filters at the bottom, you can filter what is shown on screen.
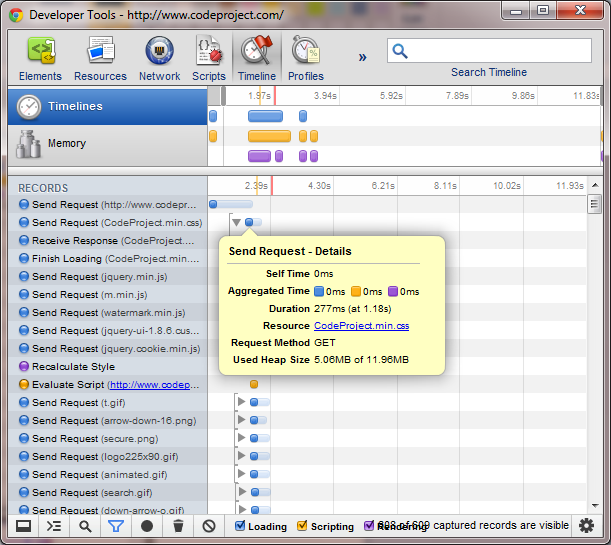
Timeline View
The timeline can be used to show all the events occurring, time to execute them, memory utilisation, etc. It is also possible to save and load captured data for later analysis (right click on the "Timelines" or "Memory" labels at the top). A selection of filtering is available (e.g. short duration, such as those < 15ms, can be hidden). By clicking on the "Timelines" or "Memory" labels at the top, you can switch the view. Below is another Code Project capture:
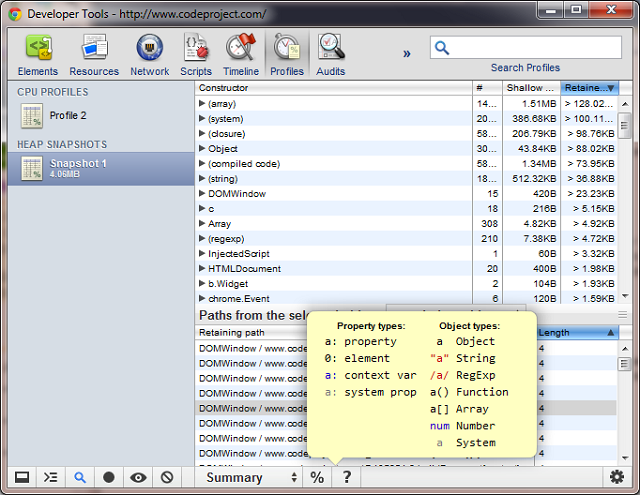
Profiles View
The "Profiles" view is when you start getting into the deep guts of browser, recording sessions and taking snapshots of memory utilisation. As this is a bit deep, I think it is well outside the scope of a beginner article. Suffice to say, it is there, and you may want to dig around in it just to see what is what.
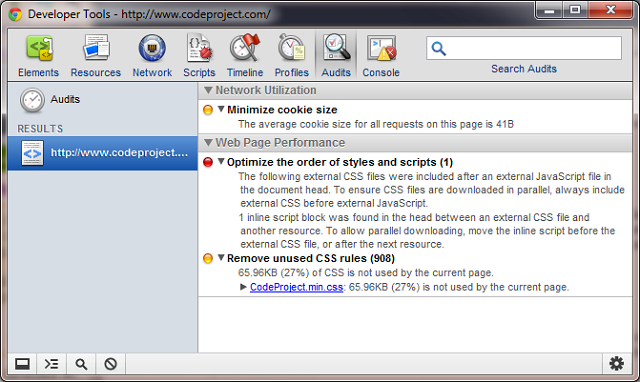
Audits View
The last thing to look at is the "Audits" view. The audits can look at the current page, or perform an audit on page reload. The audit will analyze the page content and provide recommendations on changes to improve page performance. As can be seen below in the audit performed on the Code Project home page, Chrome makes recommendations about script and CSS locations to improve parallel downloading. Again, this is really just for info, and up to you if you want to dig deeper.
Summary
As you can see, there is a lot going on in the debugger and it can be a very powerful tool, particularly around JavaScript coding. I certainly have found it very useful. As with anything like this, the best thing to do is just play around with it. Hopefully now that you know it is possible to edit and tweak JavaScript functions and variables in memory, it will save you some time from going back and forth from the IDE while trying to pinpoint issues.
There are many more features still not covered, such as event breakpoints or digging deeper into objects. However, if you get to grips with the items covered above, you will be able to work out these additional features for yourself. As usual, just experiment and learn as you go.
Hope you found this a useful insight to the debugger and maybe I have shown you things you never knew (I certainly found out a few things while writing it!)
Thanks for reading.
History
- 27th November 2011 - V1.5, Removed invalid console reference, minor text change
- 8th November 2011 - V1.4, Added Console Timer section
- 29th October 2011 - V1.3, Typo corrections
- 28th October 2011 - V1.2, Typo corrections, added exception mode reference
- 25th October 2011 - V1.1, Typo corrections, image amendments
- 24th October 2011 - V1.0, Initial release