Building .NET Coverage Tool
4.94/5 (32 votes)
This article is a walkthrough for building a .NET coverage tool
- Download demo project - 194.16 KB
- Download source (Mono.Cecil, pdb2mdb sources included - rev. 140458) - 604.27 KB
Contents
- Introduction
- The Problem
- PDB Parsing
- Assembly Alteration
- Sequence Point Hit Counter / Report Updater
- Results
- Usage
- Possible Improvements
- Getting the Sources
- Credits
- History
- Note to License
Introduction
This article is a walkthrough for building a .NET coverage tool.
After having spent some time configuring build tools to use NCover Community Edition (one must be registered in order to download a free community edition), and having listened to complaints regarding its frozen beta status, as well as a high price of the commercial version, I decided to study alternatives. One of the alternatives to NCover is a source-code instrumenting opensource project which is also called NCover - NCover opensource. Modification of a source code is definitely a solution but is undesirable for most of the large projects. Another coverage tool is integrated into VS Team Edition which is not free. Moreover, it is limited to the Microsoft Unittesting Framework only.
The main alternative to commercial NCover is an open-source profiler-based PartCover tool. This tool has its own coverage browser and is also integrated into latest SharpDevelop.
Other .NET coverage tools on the net are: Clover.NET (now deprecated), Prof-It for C# etc. All of them seem to be either commercial or deprecated.
The Problem
The idea behind coverage tools seems quite simple. All one has to do in order to build a coverage for an assembly is to instrument it and register hits of all sequence points during execution. For more details on code coverage, see Code Coverage article on Wikipedia.
The .NET Profiling API can perform execution-time instrumentation of assemblies, however it is COM-based and therefore requires unmanaged platform-dependent code.
Another approach which could solve the coverage calculation problem is instrumentation of compiled assemblies. We will further concentrate on this approach. According to it, the coverage calculation problem could be split in two stages: instrumentation and execution.
In this article we will go through the development process of the solution which will instrument assemblies and will generate coverage report file with a list of sequence points and bookmarks to segments of source code which correspond to these sequence points. This file should be updated with the statistics of hits of sequence points during the execution of instrumented assemblies.
Note: As a format of the mentioned file, I decided to reuse NCover community edition report format in order to be able to use it with existing tools which are based on it (NCoverExplorer, etc.).
The solution could be split into three steps:
Let's take a closer look at these stages.PDB Parsing
PDB (program database) files store a list of sequence points in an assembly with their addresses and the name of the file and the line on which the sequence point was declared (in the source-code). Google suggests two existing PDB parsers: mono.tools.pdb2mdb and pdb2xml from Microsoft Mdbg.CorApi samples. Microsoft Mdbg.CorApi samples utilize COM-objects and are not cross-platform. Therefore we will use Pdb2mdb for PDB parsing. However, the main goal of the mono.tools.pdb2mdb is not PDB reading functionality (its PDB reader related classes are marked as Internal). We will hide the functionality of PDB reading behind a simple interface:
public interface IProgramDatabaseReader
{
/// Loads program database file that corresponds to assembly
void Initialize(string assemblyFilePath);
/// Retrieves source code segment locations with
/// corresponding offsets in compiled assembly for given method
///
/// Returns Dictionary:
/// Key - an instruction offset
/// Value - source code segment location
IDictionary
With this interface, it should be easy enough to substitute pdb2mdb with alternative pdb reading engine or, for example, add support for mdb file parsing in order to build coverage for Mono compiled assemblies.
Assembly Alteration
Functionality that is provided by Mono.Cecil framework is sufficient for assembly instrumentation, however, some difficulties are worth pointing out. First of all, in order to instrument a strongly typed assembly, its name and references to other strongly typed assemblies should be weakened. This can be accomplished by the following code:
assembly.Name.PublicKey = null;
assembly.Name.PublicKeyToken = null;
assembly.Name.HasPublicKey = false;

var refs = assembly.MainModule.AssemblyReferences;

foreach (AssemblyNameReference reference in refs)
{
	var original = reference.ToString();

	reference.HasPublicKey = false;
	reference.PublicKeyToken = null;
	reference.PublicKey = null;
}
Additionally, we need to consider the following fact: type references in attributes are stored separately from assembly references. For example,
[Test]
[ExpectedExceptionAttribute(typeof(SomeCustomException))]
public void TestSomeCustomException() {}
will be compiled into something like:
.custom instance void [nunit.framework]
  NUnit.Framework.ExpectedExceptionAttribute::
   .ctor(class [mscorlib]System.Type) = ( some bytes )
Where some bytes stands for byte representation of a string like:
 "MyApp.Exceptions.SomeCustomException, MyApp, Version=1.0.0.0,
		Culture=neutral, PublicKeyToken=c7192dc5380945e7".
And the hardest part about it is that it's not possible to track this information by Reflector because Reflector automatically substitutes this string with a hyperlink to a type (one may use ILdasm though).
To sum up, we may say that in order to accomplish reference weakening - not only assembly manifest should be changed to contain weaker references, but also all custom attributes of all members of the assembly should be checked for strings holding strong reference and altered accordingly.
Notes: Common Language Runtime Detected an Invalid Program
One of the most unclear exceptions which could occur during assembly instrumentation is a weird error produced by CLR: "Common Language Runtime detected an invalid program". The way I found to track this error to its origin is to execute ngen tool on the broken assembly. As a result, this error would become a bit more helpful and would point to a broken method. Here is the list of possible circumstances and how to overcome them:
- Some of the short form "
goto" (branching) operators may have operand overflow after method body has increased (during instrumentation).
This can be solved pretty easily usingmethodDef.Body.Simplify(); methodDef.Body.Optimize();pair of methods (source). - In order to instrument a particular instruction, we need to insert instumentation instructions before it, and change all the references to this instruction (which is being instrumented) to the first instrumentation instruction of the instructions which we have inserted. As a result, all references to the instruction being instrumented would be updated to point to our instrumentation code.
Tryandcatchcommands are stored separately from instructions, and need to be instrumented separately: start/end offsets of thetryblock should be moved in order to point to the first instrumentation instruction of a corresponding sequence point instead of the sequence point itself
For more details on 2 and 3, please look at Coverage.Instrument.InstrumentorVisitor.VisitMethodPoint:
/// <summary>
/// Instruments method instruction, that has corresponding segment of source code
/// </summary>
public override void VisitMethodPoint( ..... )
{
	..........

	///Change references in operands from "instruction"
	///to first counter invocation instruction (instrLoadModuleId)
	foreach (Instruction instr in context.MethodWorker.GetBody().Instructions)
	{
		SubstituteInstructionOperand
			(instr, instruction, instrLoadModuleId);
	}

	var exceptionHandlers = context.MethodWorker.GetBody().ExceptionHandlers;
	foreach (ExceptionHandler handler in exceptionHandlers)
	{
		SubstituteExceptionBoundary
			(handler, instruction, instrLoadModuleId);
	}
}
Sequence Point Hit Counter / Report Updater
All hit counts would be stored in memory and on any of either AppDomain.CurrentDomain.DomainUnload or AppDomain.CurrentDomain.ProcessExit events would flush changes to the XML file. Path to the XML file can be retrieved using getter Coverage.Counter.CoverageFilePath - this getter is changed using Mono.Cecil to return the actual path. The DLL file which contains the counter (Coverage.Counter.dll) is copied to the folder of an instrumented assembly (because instrumented assemblies reference counter DLL.)
Results
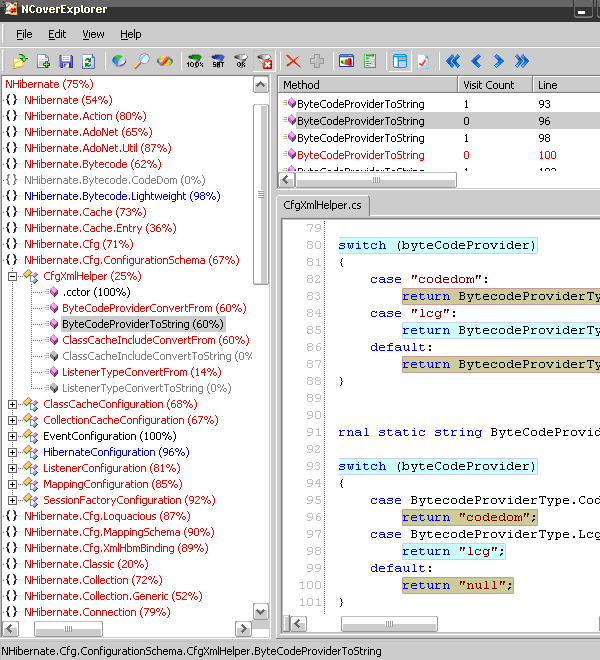
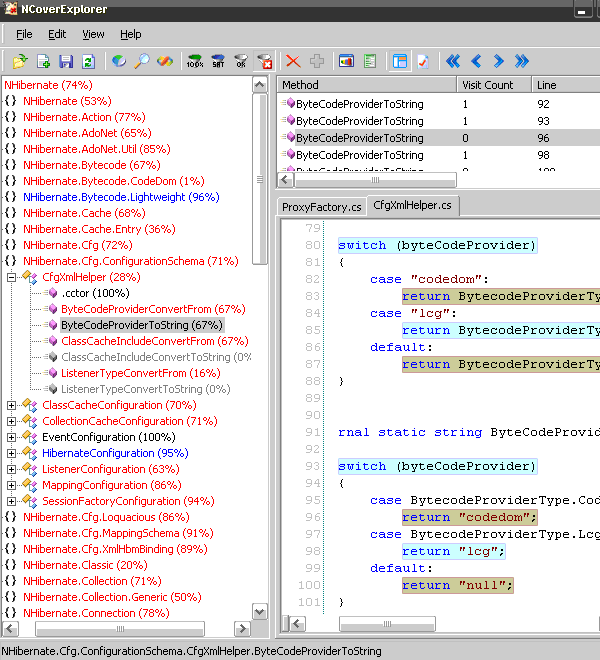
Here are the results of testing of the tool against NCover. I ran both tools on NHibernate unittests (trunk nhibernate 3 alpha).
NCover results:

Coverage tool results:

Precision
The difference in percentage of method coverage is due to duplicate sequence points in instrumented assemblies. Prevention of these duplicates is one of the possible improvements for the tool. Yet, you can see that the coverage percentage is still close enough to the one of NCover, and the displayed covered/uncovered lines are the same.
Performance
Instrumentation of all NHibernate assemblies took about 6-10 secs, but tests on instrumented assemblies ran twice as slow than the same tests on assemblies instrumented by NCover. Additionally, another 5 seconds were spent in order to flush the report XML after nunit termination.
Reliability
The tool was tested on small programs / libraries; NHibernate framework unittests (around 2000 tests); NInject framework unittests (around 200 tests). Yet only one test in NInject framework was broken
(Ninject.Tests.DebugInfoFixture.DebugInfoFromStackFrameContainsFileInfo).
Usage
The tool itself is a console application. Here are possible command line parameters:
coverage.exe {<AssemblyPaths>} [{-[<FilterType>:]NameFilter}] [<commands>[<commandArgs>]]
- AssemblyPaths - file system masks for DLL/EXE files, i.e.: "C:\Temp\Libs\NHibernate* C:\Temp\NInject\NInject.Core*"
- Filter Types:
- f: - exclude files by name
- s: - exclude assemblies by name (This could be useful if strong name for some assembly should be weakened, however, coverage report is redundant for it)
- t: - exclude types by full name
- m: - exclude methods by full name
- a: or nothing - exclude members by their custom attribute names
- Commands:
- /r - If this command is selected - instrumented assemblies replace existing ones. Old assemblies are backed up along with corresponding pdb files
- /x <coverage file path> - Path to a coverage XML file
Usage Example
coverage.exe C:\Temp\myapp.exe C:\Temp\myapp.lib.dll -CodeGeneratedAttribute
					-t:Test /r /x C:\Temp\coverage2.xml
This will generate instrumented myapp.exe and myapp.lib.dll, moving old assemblies into myapp.bak.exe and myapp.lib.bak.dll respectively. Members marked by attributes that contain 'CodeGeneratedAttribute' in their name as well as types that contain 'Test' in their full names will be excluded from the report.
Possible Improvements
There are a couple of things that come to my mind (except making the tool to be bug-free).
- Remove duplicate instruments - and therefore improve performance and precision
- Make flushing of hit counts to XML file immediate
- Add support for Mono mdb files and port the tool to Linux (I am not sure that this is necessary because there is already a monocov tool for Mono)
- Create pdb[/mdb] files for instrumented assemblies, so that it will be possible to debug even those
- Calculate coverage without pdb files - this will require syntax analysis of the IL code. As for this point, I had some thoughts to reuse
nopoperators as indicators of code branching, however, it requires DLL do be built using debug configuration and therefore is not likely to be used (because debug-built assemblies usually have pdb-s with them) - Mixed mode - reuse pdbs of different builds as a reference
Getting the Sources
You can get the latest sources of the project here.
Credits
Thanks to guys from Mono.Cecil mailing list for helping me out with my issues.
History
- 24-08-2009 - Original version of the article
Note to License
- Mono.Cecil is licensed under The MIT License
- Mono.Tools.pdb2mdb is licensed under The Microsoft Public License (Ms-PL)
