
Making SVG Charts with Common Objects
4.79/5 (15 votes)
This article explains how to create some interesting charts in SVG documents
Introduction
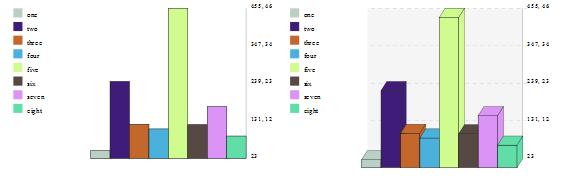
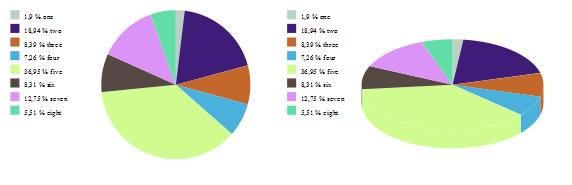
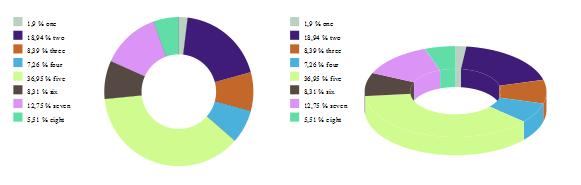
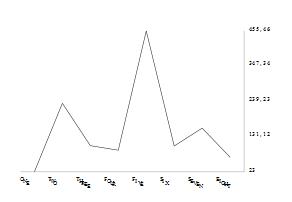
This article tries to explain how we can make some interesting charts such as Pie chart, Doughnut chart, Histogram chart and Linear chart to represent data. The following picutures are examples of how they look like.
My project contains two libraries in order to create one of those charts. The first library (SVGObjects) contains some of the common svg objects that we need to create a well formatted svg document. Of course, we can add more if needed. We'll use the second library (Charts) to format the charts. Notice that we only have one way to input data to be transformed, this is using a DataTable. Of course, we can modify the projects, adding more interfaces in order to accept other types of objects that contain data such as Hashtables or XmlNodes.
Background
Charts is a hierarchical class library. All classes used to create those charts have the method GenerateChart. The only thing that we have to do to call this method is to pass in the chart data with a DataTable object containing two columns, one with the chart labels as strings and one with the chart values as doubles.
There are some interesting features:
- Using guide lines
We can setWithGuideLinesproperty in order to create four guide lines in whatever ofAxisChart's class, to understand the data representation better. - Dividing the legend
In some cases, using the Linear chart, we'll be interested in dividing the legend in a certain amount of items. This probably happens when we have a lot of rows in theDataTable. To reduce the number of these items, when we create the object, we must pass the number of items that we want to use. - Background color
In charts that inherit fromAxisChartthere is theBackgroundColorproperty in order to set the background color of the chart if it is pleased. - Random Color
Depending on the number of the Datatable's rows the system gets the colors for the legend and the chart.
Using the Code


It's very easy to create charts with the Chart library. We just need to instantiate an object of the required chart class (e.g. PieChart), passing these parameters to the constructor: width, height and number of legend items if we want it. Afterwards we have to call the method GenerateChart and save the XmlDocument that it has given us.
Creating a Pie Chart
DataTable tbValues = GetData();
PieChart chees = new PieChart(300, 200, tbValues.Rows.Count);
XmlDocument xml = chees.GenerateChart(tbValues, "name", "value");
SaveDocument(xml);
You can create a 3D Pie Chart by using the Pie3DChart object instead.
Creating a Doughnut Chart
DataTable tbValues = GetData();
DoughnutChart doug = new DoughnutChart(300, 200, tbValues.Rows.Count);
XmlDocument xml = doug.GenerateChart(tbValues, "name", "value");
SaveDocument(xml);
You can create a 3D Doughnut Chart by using the Histogram3DChart object instead.
Creating a Histogram Chart
DataTable tbValues = GetData();
HistogramChart hist = new HistogramChart(300, 200, tbValues.Rows.Count);
XmlDocument xml = hist.GenerateChart(tbValues, "name", "value");
SaveDocument(xml);
You can create a 3D Histogram Chart by using the Histogram3DChart object instead.
Creating a Linear Chart
DataTable tbValues = GetData();
LinearChart line = new LinearChart(300, 200, tbValues.Rows.Count);
XmlDocument xml = line.GenerateChart(tbValues, "name", "value");
SaveDocument(xml);
The objects that are used by SVGObjects library contain the main attributes to make a chart. In some cases, the attribute names are not the same as the names of the svg elements they represent and some of their properties are omitted. This is to simplify the object creation. To address that, the Charts library needs to transform those objects to a well formatted svg document.
In order to do this, the library uses an XSLT template.
Transforming to a Well Formatted svg Document
protected XmlDocument Transform()
{
    XmlDocument xmlResult = new XmlDocument();
    XslCompiledTransform xslt = new XslCompiledTransform();
    xslt.Load(AppDomain.CurrentDomain.BaseDirectory + @"\Charts.xslt");
    XPathNavigator nav = this.Doc.ToXml().CreateNavigator();
    StringBuilder sw = new StringBuilder();
    XmlWriter xr = XmlWriter.Create(sw, null);
    xslt.Transform(nav, xr);
    xmlResult.LoadXml(sw.ToString());
    return xmlResult;
}
Using the SVG Document
We can use the SVG Document in a HTML Document by using the tags object, embed or iframe. There are some differences between those tags, let's have quick a look.
Mainly, the difference reside in the browser the client is using and the HTML version in that the document is written. So, if we want to write a XHTML Document we cannot use the embed tag due to it is not supported. The iframe tag works in most browsers.
Even though SVG is an standard and is currently natively supported in most browsers, IE does not. IE does it by using the SVG Viewer pluggin developed by Adobe. This is a pitty, due to Adobe announced at the begining of 2009 that they were not going to support this pluggin any more. I guess that Silverlight has some part of guilt.
<embed src="histogram.svg" width="300" height="100"
type="image/svg+xml"
pluginspage="http://www.adobe.com/svg/viewer/install/" />

<object data="histogram.svg" width="300" height="100"
type="image/svg+xml"
codebase="http://www.adobe.com/svg/viewer/install/" />

<iframe src="histogram.svg" width="300" height="100">
</iframe>
History
- 4th November, 2009: Initial post
- 28th May, 2010: Doughnut Chart
- 22nd Jun, 2010: 3D Charts