
ANTS Profiler
0/5 (0 vote)
Dec 17, 2004
6 min read
45139
Understand how your .NET application uses memory
Introduction
(Click here for your free trial)
Last month we told you about profiling performance with ANTS Profiler, the simple .NET profiler. This time we would like to tell you about how ANTS Profiler can help you understand how your application uses memory.
ANTS Profiler allows you to identify slow lines of code in .NET applications within 5 minutes of installation, allowing you to get on with what you do best – writing code. The program can be used to:
- measure line-level and method execution times
- understand how your application performs
- understand how your application uses memory
Profiling an application with ANTS Profiler
ANTS Profiler will profile Windows applications, ASP.NET web applications, COM+ applications and .NET web services. It supports applications written in VB.NET, C#, C++ (managed) and any other language supported by the .NET framework.
Profiling memory
This walk-through will give you an overview of the memory profiling features of ANTS Profiler. It is based on a demonstration Windows application, ShapePainter.exe, that creates a series of objects and draws them on the screen. The application creates random rectangle, ellipse, and triangle objects and plots them in the Shape Painter window:
Each of the shapes on screen corresponds to an object on the managed heap. This part of the walk-through shows how you can use the ANTS Profiler to inspect the objects created by the application.
The first step is to launch ANTS Profiler and use the "Profiler Project Wizard" to specify the type of profiling you want to perform. We select "Profile memory" to specify that we want to examine what objects have been created, and where those objects were created. We click the "Next" button to continue.
The next step is to specify the type of .NET application you want to profile:

You can choose to profile either a .NET desktop application, ASP.NET web application or a COM+ server application. ShapePainter.exe is a .NET desktop application so we choose this option and click the "Next" button to continue.
The next step in the "Profiler Project Wizard" requires you to specify the application executable file. We browse to locate the file ShapePainter.exe and click the "Finish" button to exit the wizard. We are now ready to start profiling.
An ANTS Profiler dialog box will pop up asking you to confirm that you want to start profiling the application. Click "Yes" to continue.
When memory profiling, you need to take a snapshot to get useful profiler results. Before profiling starts the following dialog will appear giving you information about taking snapshots of your application:

Click the "OK" button to launch the application.
When you start profiling, ANTS Profiler launches the application, in this case the Shape Painter, and makes it active so you can run through those parts of your application that you want to profile. When the Shape Painter runs it draws 200 random shapes in the window. Each of the shapes on screen corresponds to an object on the managed heap.
Because we are memory profiling, we now need to take a snapshot in order to get useful profiler results. To do this we bring the ANTS Profiler window to the front, and then click the "Take snapshot" button in the toolbar:
![]()
This creates a set of results corresponding to the current state of the application. We then bring the Shape Painter window to the front again and continue to use the application – we click "Add rectangles" to create a further 10 rectangle objects. Then we switch to the ANTS Profiler window and click the "Take snapshot" button again to create a second set of results.
The ANTS Profiler window initially shows a "Summary" of the results for the last snapshot. The "Summary" contains basic information about your application along with the "10 Biggest live objects" and "10 Classes with the most live instances." You can click on any of the links in the "Biggest live objects" list to navigate to particular objects.
The "Results" window shows the two sets of results captured:

You can switch between the two sets of results by double-clicking each of the results in turn. In this case, in the "Classes with the most live instances” list we should see that the number of objects in the "ShapePainter.RectangleShape" class increases by 10 between the two snapshots.
If you are interested in how many objects have been created in each class, you can go to the "All classes" panel to see a list of all the classes. We can click the "Class name" column, to sort the classes by class name, and then we scroll down to the "RectangleShape" class:

You can see the total number and total size of "RectangleShape" objects.
If you are interested in an object not listed in the "Summary" you can go to the "All objects" panel to see all the objects in a grid. When you are viewing the "All objects" panel you can sort, filter, and group the methods as you want. You can drag the "Namespace" column header into the bar above the grid to group by that column, or, in this case, click the + to the left of the "Namespace: ShapePainter" bar to expand the grid and show the ShapePainter objects:

We can then click an object of class "RectangleShape" to select it.
When you click any object in the "All objects" or "Summary" panel, the "Hierarchy" panel is updated to show details of the object together with the objects it "Refers to" and is "Referenced from":
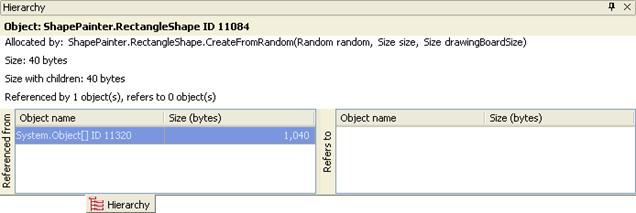
This shows that the "RectangleShape" object is 40 bytes, and that it is referenced from a "System.Object[]".
When you click any object in the "All objects" or "Summary" panel, the "Source code" panel will automatically update to show the source code where the object was created:

This shows that the "RectangleShape" object was created by the method "CreateFromRandom()".
If you are interested in the sequence of calls that created an object you can go to the "Call stack" panel to see a list of all the methods called. In this case, we need to click the "Object type" heading, in the "All objects" panel, to sort by object type, and scroll down to find the "RectangleShape" object with the lowest Age. We then select the "RectangleShape" object and click "Call stack" on the View menu to display the "Call stack" panel. The third line in the call stack shows that this shape was drawn when the Shape Painter application was launched:

In the "All objects" panel we scroll down to find the "RectangleShape" object with the highest "Age", and then select the "RectangleShape" object. The third line in the call stack shows that this shape was created when we clicked the "Add Rectangles" toolbar button:

As you can see, ANTS Profiler is a tool that lets you get to what you need to know about your application very rapidly. The best way to find out how well ANTS Profiler will work for you is to download your fully functional, fully supported free trial.
A vital development tool
ANTS Profiler is a simple .NET profiler that gives you the information you need simply and rapidly. Appropriate pieces of code can then be optimized, so performance is improved, and hardware requirements are lowered. It is simple to use, and the results produced make it easy for any .NET developer to understand where bottlenecks or problems lie.
Evaluate ANTS Profiler with your applications to see how well it will work for you - download a free, fully functional, fully supported, 14-day trial.