Introduction
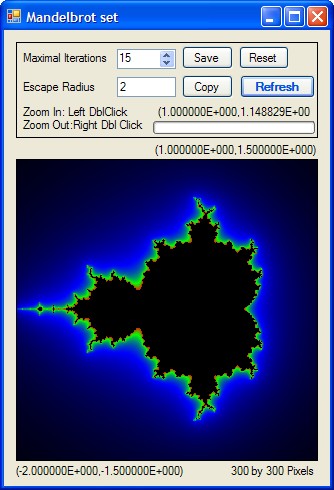
This program implements a simple way to see a Mandelbrot set. There are tons of programs like this one. But because of a Science library, SCI[1] , it allows us to calculate f(z) = z * z + C directly.
Main Loop of Code
There is a pseudo-code on Wikipedia[2].
Sci.Math.ComplexNumber C = z;
int iteration = 0;
while (z.Modulus < escapeRadius && iteration < maxIteration)
{
    z = z * z + C;
    iteration++;
}

int colorIndex = 0;
if (iteration < maxIteration)
{
    z = z * z + C; iteration++;
    z = z * z + C; iteration++;
    double mu = iteration - (Math.Log(Math.Log(z.Modulus))) / logEscapeRadius;
    colorIndex = (int)(mu / maxIteration * 768);
    if (colorIndex >= 768) colorIndex = 0;
    if (colorIndex < 0) colorIndex = 0;
}
For each point C in viewport, C would be substituted into f(z) = z * z + C as z, then the result would be substituted again, iteratively until iteration steps reaching maxIteration or modulus of the result is greater than escapeRadius. mu
is for smoothing image result. Please refer to [3] for more details about mu.
Then, according to the iteration steps, decide what color would be used for this coordinate. There is a Color array for speeding the look up. Colors[] is generated
by using:
for (int i=0;i<768;i++)
{
    int colorValueR=0;
    int colorValueG=0;
    int colorValueB=0;
    if (i >= 512)
    {
        colorValueR = i - 512;
        colorValueG = 255 - colorValueR;
    }
    else if (i >= 256)
    {
        colorValueG = i - 256;
        colorValueB = 255 - colorValueG;
    }
    else
    {
        colorValueB = i;
    }
    Colors[i] = Color.FromArgb(colorValueR, colorValueG, colorValueB);
}
The values inside Colors look like:
index Red Green Blue
  0    0    0    0
  .    0    0    .
 255   0    0   255
 256   0    0   255
  .    0    .    .
 384   0   128  127
  .    0    .    .
 511   0   255   0
 512   0   255   0
  .    .    .    0
 640  128  127   0
  .    .    .    0
 767  255   0    0
Screen Point To Coordinate On Plane Conversion
When the cursor moves on an image, there is a label showing the current coordinate on the plane:
int x = e.X;
int y = (control.Height - 1) - e.Y;
Sci.Math.ComplexNumber P = P2 + new Sci.Math.ComplexNumber((double)x *
            (P1.Re - P2.Re) / (p.Width - 1),
            (double)y * (P1.Im - P2.Im) / (p.Height - 1));
pos.Text = String.Format("({0:E},{1:E})", P.Re, P.Im);
The e.X and e.Y are points on the screen, the unit of which is pixels. The origin is at the top and left-most. In other words, the x-axis on the screen and plane have the same direction. But the y-axis is not the same.
Scaling Image
When the user double-clicks, the clicked point on the image has to be converted into the coordinate of plane. The coordinate of the clicked point would be the center point of the new image, with scaling factor 2.
int x = e.X;
int y = (control.Height - 1) - e.Y;
Sci.Math.ComplexNumber P = P2 + new Sci.Math.ComplexNumber((double)x *
(P1.Re - P2.Re) / (p.Width - 1),
(double)y * (P1.Im - P2.Im) / (p.Height - 1));
Sci.Math.ComplexNumber diff = new Sci.Math.ComplexNumber();
switch (e.Button)
{
case MouseButtons.Left:
diff = (P1 - P2) / 2 / 2;
break;
case MouseButtons.Right:
diff = (P1 - P2) / 2 * 2;
break;
}
P1 = P + diff;
P2 = P - diff;
This program use two ComplexNumbers to define the viewport. P1 is at the topmost and rightmost, and P2 at the bottommost and leftmost. P is the center coordinate in the original viewpoint bounded by P1 and P2. The diff represents the vector from P to new P1, which is P1 of viewport after zooming.
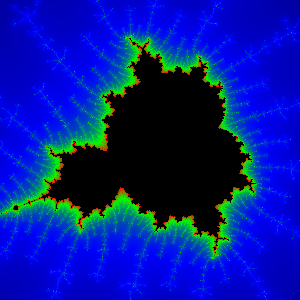
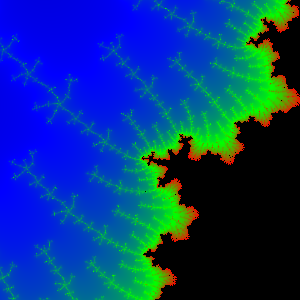
Some Screenshots
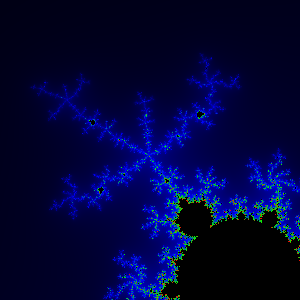
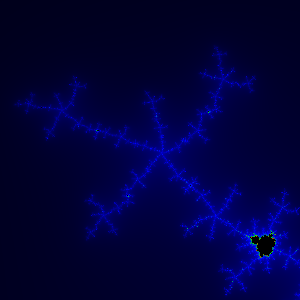
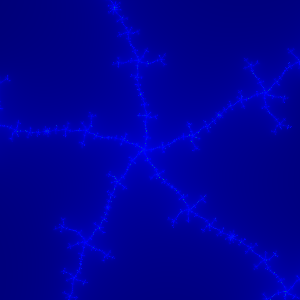
All are with maximal iteration=150 and escape radius=2:
Conclusion
The implementation of the Mandelbrot set is really easy. But the drawing part might meet with a bottleneck. Therefore, the code uses a lower-level method to draw, instead of calling SetPixel directly. You can also try to change the polynomial f(z) to get some interesting images.
Links
- SCI
- Mandelbrot set
- Smooth Shading for the Mandelbrot Exterior
History
- 2007/04/12 - First edition
