Introduction
Whenever there is a bug in your program, you usually open a debugger (GDB, Visual Studio debugger, etc.) to fix it, but how do you debug a bug in the operating system? Do you load the running OS into the debugger? Is it possible? The simple answer is no, Because even the debugger works with the help of OS. It's a Catch 22 situation.
History
Earlier developers used two machines; one is the defective OS(slave) and other machine is the one containing debugger software(master). Now the defective slave is connected to master machine using a high speed cable, and then both slave and master machines are started, with the help of debugger the execution of slave machine is paused. But this solution has some drawbacks.
- The connection speed between the machines is too slow, because the data and commands should be passed to and fro between master and slave.
- Requires extra hardware like cable and two separate machines
Current Process
Fortunately, we now have much better options for beginners who want to study the internals of the OS by debugging. With the help of virtual machines, now we do not require two separate machines. The slave machine can be thought of as a guest VM and master machine can be thought of as a host computer(your real physical machine). The connection between these host and guest have been made even simpler with the help of a software called VirtualKD(Virtual Kernel Debugger)[without this tool, we have to manually set up a named pipe in the guest and modify boot.ini to enable some special options. It's a little time consuming]. So in this tutorial, I will help you set up kernel mode debugger.
I will be using the following tools:
- WinDbg (Windows Kernel Debugger)
- Virtual Box (Virtual Machine Manager)
- VirtualKD (Tool to enable very high speed kernel debugging between host and just machines)
Hereafter, whenever I refer to OS, it will be one version of Windows.
- First thing we have to do is install virtual box and then install a guest OS of your choice. Here I would like to demo using Windows XP as my guest [installing a guest VM].
- Second, extract the virtualKD to some folder.
Rename the VBoxDD.dll file in your VirtualBox program files folder to VBoxDD0.dll.Copy modified VBoxDD.dll from VirtualKD archive to VirtualBox directory (Ensure that you have selected correct version (x86 or x64) of VBoxDD.dll).

- Third, install WinDbg (simple next next install).
For any debugger to properly work, we should have symbol files of the program being debugged, think of these files as extra information about your program which helps debugger in displaying meaningful information to the user. If we have correct symbol files, we will have the extract function names and the line numbers, etc. getting shown in the debugger, without that we will see some hard to understand Hex address. So the following few lines will help you configure symbol files for your operating system.
If you have internet connection all the time, follow this:
- Create an environment variable named
_NT_SYMBOL_PATH and set its value to say srv*c:\symbols*http://msdl.microsoft.com/download/symbols
- Symbols will be downloaded from the Microsoft symbol server on demand to c:\symbols
Else follow this:
- Create an environment variable named
_NT_SYMBOL_PATH and set its value to say c:\symbols
- C:\program files\symchk.exe /r c:\windows\system32\* /s SRV*C:\symbols\*http://msdl.microsoft.com/download/symbols
- The above command will fetch all the symbols for the files in
system32 at once (takes time and space).
- It's a one time task.
When WinDbg is launched, it will check this variable to know the path of symbol files.
- Fourth, run
VirtualKD in the guest machine and then reboot the guest as instructed. 
- Once you are at the boot prompt, open:

- Choose the highlighted one and then open vmmon.exe from
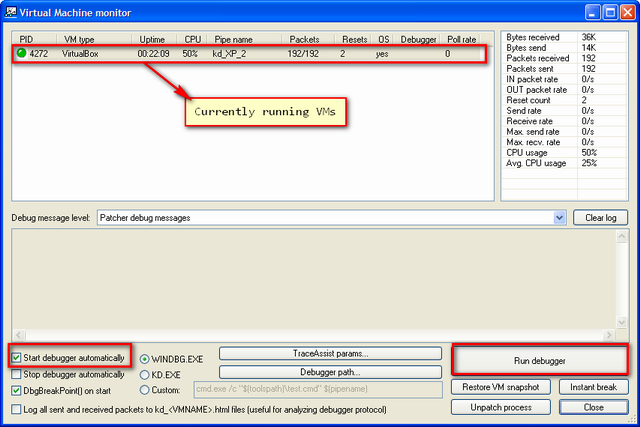
VirtualKD which will automatically launch WinDBG and connect to the currently running VM and pauses its execution:


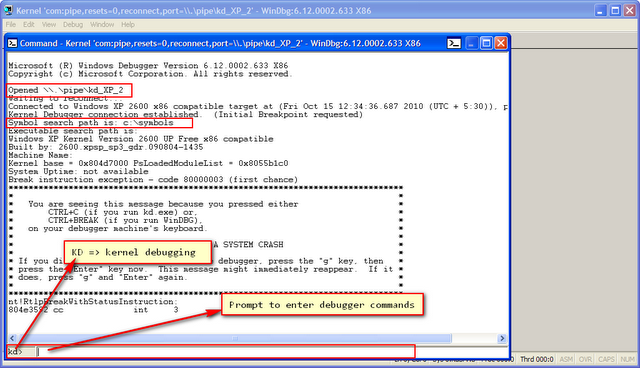
- In the above illustration, if you see the first highlighted rectangle,
Windbg is connected to the guest using named pipe \\.\pipe\kd_XP_2.
- Symbol files are picked up from c:\symbols, this is where our
_NT_SYMBOL_PATH points:

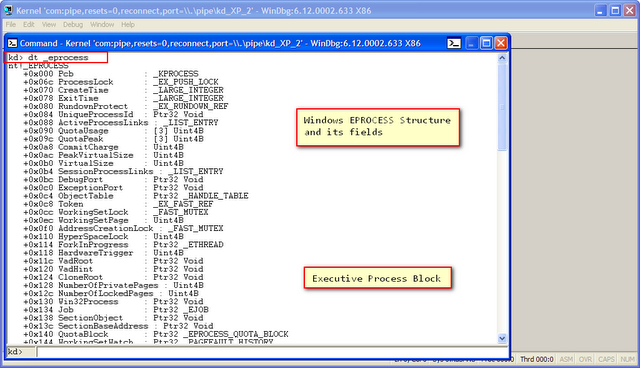
- Most of the
windbg commands are explained very clearly at http://windbg.info/doc/1-common-cmds.html.
References
- Windows Internals 4th Ed By Mark E. Russinovich, David A. Solomon
Happy debugging.
History
- 23rd November, 2010: Initial post
