Table of Contents
Introduction
This article introduces an optimized enter and leave log in your code. Sometimes we put
TRACE()
, or other methods in all functions to identify the call sequence of our
software system. If all functions call
TRACE(), indicating some thread entered in this function or returned from a function, then at a later time, or when an issue happens, developer can check these log files to identify the improper call sequence or incorrect call sequence. Anyway, Enter and Leave logs in a software system will be helpful to identify issues at a later time. Here a simple concept is implemented with two
applications (LogTest and LogParser). Please send your suggestions and comments to improve this logging mechanism and it will be my pleasure to correct/improve this Enter/Leave log method.
Background
There are many ways to prepare Enter and Leave log of all functions. Preparation of a formatted log will consume a small amount of processor time.
If we can prepare required data in an encrypted or raw form at runtime, then it will reduce the processing cost. The encrypted or raw form of data will be converted to readable format
at later time, or whenever needed with the help of PDB files. PDB files contain all information ( source file names, function names. etc ) of a binary,
then It will be easy to convert these instruction address at runtime to a function name at a later time with the help of corresponding PDB files.
Details
There are many methods to provide Enter and Leave log of a function.
An
example code will be like this:
Class1::Fun1()
{
MyLogger::Log( "Entering Class1::Fun1()");
Do necessary things of Fun1()
MyLogger::Log( "Leaving Class1::Fun1()");
}
And its log file will be like this.
 LogFile.txt
Time    	Log
---------------------------------------------
08:10:22:00 Entering Class1::Fun1()
08:10:22:10 Leaving  Class1::Fun1()
Here I present an optimized way to log Enter and Leave information of functions. It is intended in Windows
operating systems. Currently it is implemented in 32 bit architecture,
and it can be prepared in 64 bit versions also. There are many methods to prepare Log or Trace information in a
software system. Most commonly it can be achieved by writing enter/ leave
information to a log file.
Here I have provided a basic view of
the Enter/Leave logging mechanism. Many other information can also be there in log files like Thread ID,
entering time, leaving time, duration of function execution, etc.
Normal logging mechanism has some disadvantages.
- Processing Cost: Loggers prepare a string indicating all information to the log file and save them to disk. The output text formatting of the function will
be a little bit costly if the frequency of logging is too high.
- Disk Space: All error logs will be saved to the hard disk (in most cases)
and it will consume some hard disk space. If the size of the log file increases, the next file writing will be slower and will create performance issues.
- Chance of Incorrect logging: If Enter or Leave log is placed in a wrong way, then Logger will provide the wrong information unless we find a problem in that function.
There is an interesting approach to reduce the processing cost of the function Enter/Leave Log. Prepare
a unique number for each function and log these numbers to a log file.
I have a suggestion to prepare a unique identifier for each function, and log this identifier instead of
the entire string, and later you can parse these identifiers and generate the function names.
An example will be like this:
enum
{
FUNCTION_1,
FUNCTION_2
};
char* pFunctionNames[]=
{
"Class1::Function1",
"Class1::Function2",
};
Class::Func1()
{
Logger::Log(FUNCTION_1);
}
Class::Func2()
{
Logger::Log(FUNCTION_2);
}
In this case numbers (instead of the whole function name) will be saved to LogFile, and at a later time (after
completion of process execution), these numbers will be converted to string.
The above suggestions are not good methods to implement in a real system. It requires a unique number for each and every function.
When a new function is added or removed we have to modify the constants and their corresponding enumerations etc.. Therefore it will be very difficult to implement this method in a real software
system.
Here is the new method.
An instruction pointer (virtual address of
instruction) holds the address of the current instruction. If the PDB (Program Data Base) file
of the corresponding binary is available, at a later time it is possible retrieve the function name from the Instruction Pointer.
The basic concept is to save the instruction pointer
of a function, instead of writing the entire function name. At a later stage, whenever the call sequence of the software
is needed, the instruction address will be converted to the actual
function names. This conversion can be performed with the help of PDB files. This way
the call sequence of all functions and threads can be easily retrieved.
It will solve the above mentioned three problems to an extent.
- Processing cost will be less because the address is saved instead of
the formatted string.
- Disk Space will be reduced: this method saves 4 bytes in x86 machines instead of
a large class name and function name.
- Chance of Incorrect Log will be avoided because it saves the address at runtime. Then
the incorrect string will not be logged.
Class1::Fun1()
{
MyLogger::Log();
Do necessary things of Fun1()
MyLogger::Log();
}
MyLogger::Log();
Implementation
1. How to get the instruction pointer of a function
When debugging an application, register windows show a register named EIP (Extended Instruction Pointer), but its contents are not accessible
programmatically.
I tried to retrieve EIP like other registers by writing inline assembly code to move the contents to my integer or
DWORD members. But it gives a compilation error
that EIP label is undefined etc.
When a function is called, a new "stack frame" will be created to allow access to both function parameters
and local function variables. When a function is called, a new stack frame is created and its address will be saved in ESP.
The following figure shows the layout of the stack in X86 machines. The EBP register in x86 machines holds the stack base pointer and can be used to access
different information related to the currently executing function. Here the return address of the called function is placed in
the very next location of EBP.
Therefore anyone can get the address of the returning function by analyzing the EBP register.
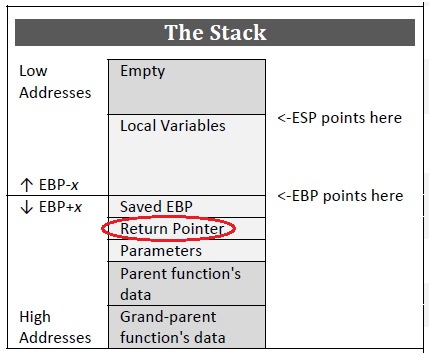
Layout of stack in X86 machines.
Then the following code can be used to get the return address of a function.
int* nAddress = new int;
__asm
{
mov nAddress,EBP
}
nAdress++;
The above information can be proved by debugging a code and analyzing the contents of
the EBP register and memory.
Following is a demonstration of the above scenario, Can I get the instruction pointer of the caller address by analyzing
the EBP register and memory?

The above code is used to analyse the EBP register and memory. Here
the _tmain() function calls
MyFunction1(), and it will call GetCallerAddress(). Put a breakpoint in MyFunction1() and note down the address of
the very next instruction
after calling GetCallerAddress(). That is 0x0033144A.
The following screenshot is the disassembly of MyFunction1().
It shows the instruction address in the left column and its corresponding assembly instruction in
the next right columns. Bold lines are the actual source code, and its assembly
will follow it in next row(s). Therefore calling GetCalllerAddress() is at 0x331445. And its assembly code is as follows.
00331445 call GetCallerAdddress(3310Dch)
After execution of GetCallerAddress(),
the program execution should switch to the instruction
at 0x0033144A.
Then put a breakpoint in GetCallerAddress(), and note down the contents of
the EBP register. And the contents near EBP is watched with
the memory watcher window. The very near location of EBP holds the address of instruction which should be invoked on returning
GetCallerAddress(), which is 0x0033144A. In the below screenshot,
the contents of the next location of EBP is watched with the memory watch window,
and it shows 4A 14 33 00 in the nearest location. 0x0033144A is represented in the above format, because Windows NT
is designed around
Little Endian Memory architecture.
Screenshot of Memory Watcher shows the contents of the EBP register
It is possible to retrieve the address of the caller function by processing
the EBP register.
The following code retrieves the caller address from the EBP register and retrieves the return address.
void GetCallerAddress()
{
int nEBPContents;
__asm mov nEBPContents, EBP
int* ptrAddress = (int*)nEBPContents
int nReturnIP = *( ++ptrAddress )
}
Now it is very easy to retrieve the address of a function from a called function.
2. Save the raw data whenever an issue occurs
We can save the function address to a file in sequential order with some other additional information like thread ID, entering time, leaving time, etc. These log information
are written to a log file. But a user or developer can't identify the order of
the call sequence from this function addresses. It is not possible to find out the name of a function from its address.
Here comes the next problem. How to retrieve the function name from the address of
a function (Instruction Pointer)?.
3. Use PDB file to get the function name from the virtual address of that function
Now we have retrieved the virtual address of all the called functions, and we will save these information to a
log file. Instead of saving the entire function name [like Entering MyClass::MyFunction1]
and Enter Leave information, we will save the virtual address of the function [as mentioned in Steps 1 and 2] with
a few added bytes indicating the time,
thread ID, enter or leave flag, etc. In a conventional Enter/Leave logging mechanism, the name of
the function will be logged to the file, and its size will be greater than four bytes in all cases.
In most cases it will take 20 to 30 bytes of data. This mechanism saves the virtual address of the function. It will be 4 bytes for all functions, even if the name of
the function is “MyClasssBlaBlaBlaBlaBlaBlaBlaBla::MyFunctionFooFooFooooFoooOooooo”. It just saves the address of the function at runtime. At a later time another application (LogParser, which is responsible
to parse the 4 byte virtual address of all functions to its original name) should read these addresses and retrieve the actual name of the function. Here
the PDB file and DIA SDK
play their role to provide the function name from the virtual address.
Before that let me say a few words related to a PDB file, a PDB file provides debug information required for a binary (DLL or exe). It contains debug information, including
the function name,
source file details, source file line numbers, function prototype, and other information.
The file format of PDB is undocumented and Microsoft proprietary, information can be extracted
from a PDB file using the DIA (Debug Interface Access) interfaces. The PDB format is hidden, and Microsoft is not willing to share the file format with us. Microsoft DIA
SDK provides different interfaces to access debug information of a binary.
More information related to the DIA SDK is available at Debug Interface Access SDK.
Steps to get the function name from a Virtual Address
The following steps are required to get the function name of an instruction address from its
PDB and binaries with DIA SDK.
- Create an object of
IDiaDataSource, COM interface.
HRESULT hr = CoCreateInstance( CLSID_DiaSource, NULL,
                                   CLSCTX_INPROC_SERVER,
                                   __uuidof( IDiaDataSource ),
                                   (void **) &m_pSource);
- Call
m_pSource->loadDataForExe( binaryFileName, PdbSearchPath,0 ) to load the debugging information of the module.
if( FAILED( m_pSource->loadDataForExe( m_ptszModuleName, m_ptszPDBPath, 0 )))
{
    return false;
}
- Create a session to query symbols from the PDB by calling
openSession.
if( FAILED( m_pSource->openSession( &m_pSession )))
{
    return false;
}
- Provide the load address of the corresponding module by calling
m_pSession->put_loadAddress(nLoadAddress).
HRESULT hReturn = m_pSession->put_loadAddress( nLoadAdddress_i );
- Call
pSession->findSymbolByVA() to get the symbol of a particular virtual address.
The first argument is the virtual address to the function, and the second argument
is SymTagFunction indicating the function details are required. An object to
IDiaSymbol will be returned.
CComPtr<IDiaSymbol> pSymbol = 0;
HRESULT hResult = m_pSession->findSymbolByVA( nFunctionVA_i, SymTagFunction, &pSymbol );
- Call
get_name() of the returned symbol and it will provide the function name of the corresponding virtual address.
BSTR bFunctionName = 0;
pSymbol->get_name( &bFunctionName );
4. Load address of all modules
In step 4, the put_loadAddress() function is called with the load address of the module. Therefore we have to retrieve the load address of
the module to process
it with the DIA SDK. On starting an application, Windows loader identifies dependent modules (DLLs) and loads them into
the process memory. Imports section of the PE holds details
of the imported functions from different DLLs. These dependent DLLs will be loaded by
the Windows loader, and made available to the process to call at a later time.
Dependent DLLs will be loaded to the preferred load address of the corresponding
DLL. If the preferred load address is not vacant, then the Windows loader will load
that particular DLL in any free address in the process, therefore the loaded address of a
DLL cannot be identified after or before the execution of the process.
In DIA (Debug Interface Access) Interfaces, prior to findSybolByVA(), the Debug
session should call put_loadAddress()
of the corresponding module.
Therefore it is necessary to retrieve the load address of all modules at runtime and save them into
a log file in some format. Later LogParser (application responsible
to parse the log) should read these module details and use them to call DIA SDK functions (loadDataForExe, put_loadAddress).
Initialization of the Logger will read the load address of all the modules and save them to
a log file and at a later time, LogParser will read the module information
and call the necessary functions (put_loadAddress) of the DIA SDK.
GetModuleInformation and EnumProcessModules APIs are used to read the information (load address, size of image) of all
the modules in the current process.
The source code to enumerate all modules of the process is as follows.
bReturn = EnumProcessModules( hCurrentProcess, phModuleArray, sizeof( HMODULE ) * nModules, &nModules );
for( int nIndex =0; nIndex < nModules; nIndex++ )
{
GetModuleInformation( hCurrentProcess, phModuleArray[nIndex], &stModuleInfo, sizeof( stModuleInfo ));
GetModuleFileName( phModuleArray[nIndex], tcBufferModule, MAX_BUFFER_SIZE );
}
findSymbolByVA() accepts a virtual address, and returns the IDiaSymbol interface to the corresponding symbol belonging to the virtual address,
or its nearest address. Before calling this function, the load address of the module should be given the IDiaSession, then conversion from
the virtual address
to relative virtual address will be performed by the DIA SDK. After that get_name() of the corresponding IDiaSymbol will provide the name of
the function.
That’s all! We got the name of the function from its virtual address (address of
the function at runtime) with the help of the PDB file.
The retrieved name of the function will be saved to the output file with additional information like Enter or
Leave, Time, Thread ID. This way a raw format log file
is converted to a readable log file.
5. Optimized way to save the time
Our objective is to save minimal data with less processing cost, i.e., Enter/Leave information of a function should be saved with minimal instructions.
GetLocalTime() can be used to get the current local time in a structure, SYSTEMTIME. This structure holds Hour, Minute, Second, and Millisecond information.
typedef struct _SYSTEMTIME {
    WORD wYear;
    WORD wMonth;
    WORD wDayOfWeek;
    WORD wDay;
    WORD wHour;
    WORD wMinute;
    WORD wSecond;
    WORD wMilliseconds;
} SYSTEMTIME, *PSYSTEMTIME, *LPSYSTEMTIME;
If we call the GetLocalTime() API, it will retrieve the current system time in
the SYSTEMTIME structure. The size of the SYSTEMTIME structure is 16 bytes,
therefore each function should save 16 bytes of data on entering and leaving the function. Here is another optimized way to get the current system time.
The
GetTickCount() API returns the number of milliseconds (as a DWORD) that has elapsed since the system was started. If we know the start-up time
as SYSTEMTIME, it is easy to convert the returned tick count to the current SYSTEMTIME structure.
In our case, we can save the tick count and local time at start-up. Conversion of a new
tick count (retrieved while entering/leaving a function) to SYSTEMTIME
will be as follows.
DWORD TickCountStart indicates the tick count at the time of startup of the application.SYSTEMTIME stStartupTime holds the SYSEMTIME structure, which contains the Minute, Second, Millisecond information.DWORD dwNewTickCount, New tick count, retrieved when entering to a function.
- Find difference between
TickCountStart and dwNewTickCount, and convert it seconds - Prepare
CTimeSpan instance timeSpan with the calculated seconds, in step 1. - Prepare
CTime instance with stStartupTime and add it with
timeSpan, returned CTime object will be the new time corresponding to
dwNewTickCount.
SYSTEMTIME TimeParser::ConvertTickCountToSysTime( const DWORD dwTickCount_i )
{
DWORD dwDiff = dwTickCount_i - m_dwStartTime; SYSTEMTIME stToAdd = m_stStartTime;
stToAdd.wMilliseconds += dwDiff;
long lSeconds = 0;
if( stToAdd.wMilliseconds > 1000 )
{
lSeconds = ( stToAdd.wMilliseconds / 1000 );
}
CTimeSpan timeSpan( 0, 0, 0, lSeconds );
int nMsOutput = stToAdd.wMilliseconds % 1000;
stToAdd.wMilliseconds = 0;
CTime stToAddObj = stToAdd;
stToAddObj = stToAddObj + timeSpan;
stToAddObj.GetAsSystemTime( stToAdd );
stToAdd.wMilliseconds = nMsOutput;
return stToAdd;
}
6. Optimized way to save Thread ID
Windows provides an API to get the ID of the current thread with the GetCurrentThreadId() function. After some searching in programming forums,
I got a method to get the Thread ID without calling any Windows functions: Thread Information Block, which holds many information related to a thread. TIB can be used
to get a lot of information on the process without calling the Win32 API. To retrieve TIB, we have to write inline assembly in our code as follows. TIB holds
the thread ID in its 0x24 location,
and its address is moved to the EAX register. The contents of EAX is moved to
dwThreadID and it can be saved to our log file. Following is the code
to retrieve the current Thread ID in a fast way.
DWORD dwThreadID;
__asm {
mov EAX, FS:[0x24]
mov [dwThreadID], EAX
}
How to use LogEnterLeave in your application
Add Log.h, Logger.h to your project. These files can be downloaded from
the Download HeaderFiles section of this article.
Logger.h should be included once in your application, say in App.cpp. Log.h contains the LogEnterLeave class declaration and definition.
To create Enter and Leave log of a function, create an instance of LogEnterLeave in
the first line of the function. That’s all, the LogEnterLeave constructor
and destructor will do the required things. LogDetails.bin and LegDetails.dat files will be created, which contain enter and log information of
the functions with LogEnterLeave objects.
Following is the class declaration of LogEnterLeave:
class LogEnterLeave
{
public:
LogEnterLeave()
{
int nEBPContents;
__asm mov nEBPContents, EBP
int* ptrAddress = (int*)nEBPContents
const int nReturnIP = *( ++ptrAddress )
WriteToFile( nReturnIP, true )
}
~LogEnterLeave()
{
int nEBPContents;
__asm mov nEBPContents, EBP
int* ptrAddress = (int*)nEBPContents
const int nReturnIP = *( ++ptrAddress )
WriteToFile( nReturnIP, false )
}
private:
void WriteToFile( const int nAddress_i, const bool bEnter_i )
{
DWORD dwThreadID;
__asm {
mov EAX, FS:[0x24]
mov [dwThreadID], EAX
}
const int nTickCount = GetTickCount();
const LOG_DETAILS_t stLogDetails = { nAddress_i, dwThreadID, nTickCount, bEnter_i };
FILE* pFile = fopen( "LogDetails.dat", "ab" );
fwrite( &stLogDetails, sizeof( stLogDetails ), 1, pFile );
fclose( pFile );
}
};
Now LogDetails.bin and LegDetails.dat are created, these are small sized log information.
The LogParser application should be used to convert the LogDetails.bin file to
a readable log file.
LogParser expects the PDB and exe files are kept in the same folder. If PDB files are in a different path,
the “PDB Search Path” button can be used
to provide the search path of the PDB files.
A sample dialog based application is created to demonstrate the usage of LogEnterLeave.
Please download the LogTest application and check its code changes in LogTestDlg.cpp and LogTest.cpp. LogTest.cpp adds a header file Logger.h,
and it will perform the necessary initialization of the logger. Please do not add Logger.h in other header or source files. After that “Log.h”
is added in LogTestDlg.cpp and its functions are modified to create a LogEnterLeave object to log Enter and Leave information. A code portion
of LogTestDlg.cpp is shown below.
void CLogTestDlg::OnBnClickedButton2()
{
LogEnterLeave LogObj; AfxMessageBox( L"CLogTestDlg::OnBnClickedButton2()" );
}
void CLogTestDlg::OnBnClickedOk()
{
LogEnterLeave LogObj; AfxMessageBox( L"CLogTestDlg::OnBnClickedOk()" );
}
void CLogTestDlg::OnBnClickedCancel()
{
LogEnterLeave LogObj; AfxMessageBox( L"CLogTestDlg::OnBnClickedCancel()" );
OnCancel();
}
Following is the output prepared by a sample execution of the LogTest application.
LogParser Application
The LogParser application is responsible to convert the binary format log information to a readable format. It reads the module details and
log details and prepares the output file in the required format.
Screenshot of LogParser application
Classes and their responsibilities:
LogParserDlg: Display main dialog of the application and handle different GUI events. This class uses all other supporting classes (ModuleParser,
PdbParser, and TimeParser) to prepare output log file. ModuleParser: It reads LogDetails.bin and saves module information (load address,
module name, image size). This file contains the module
information of all dependent modules in the process. GetModuleFromVA receives a virtual address and returns
the MODULE_INFO_t that holds the details of the module loaded in the specified virtual address. PdbParser: This class is a wrapper of the DIA SDK, it provides two public member functions,
Initialize()
and GetFunctionNameFromVA(). Initialize() receives a module name and load address of the module. DIA component instances (IDiaDataSource,
IDiaSession) are created for that module. Then querying function names will be made with these component instances.
GetFunctionNameFromVA() reads a virtual address and returns the name of
the corresponding function.TimeParser: This class receives the start time (as SYSTEMTIME) and start tick count (a
DWORD) in its constructor.
Then ConvertTickCountToSysTime() can be used to convert a new Tickcount to
SYSTEMTIME. Details are explained in an optimized way to save the
time
section in this article.
Limitations
- This method cannot be used for modules loaded with explicit linking. If a
DLL is loaded at runtime by
LoadLibrary(), then its module load address cannot be tracked at startup.
And the same load address may be assigned to other modules at a later time. I have a plan to hook LoadLibrary()
and FreeLibarary() to track the load address of the modules with an explicit link method. - This method cannot be used to provide RealTime logging (like logging to console) that we can see
during execution of the program.
It saves the data in raw format and is not understandable directly. LogParser is required to convert the log to readable format.
- Logs from multiple threads are not implemented in LogEnterLeave. It is possible to add a
CriticalSection instance to lock the LogFile
written by multiple threads. - If PDBParser uses an incorrect PDB file, then this mechanism will provide
the wrong information. There is another mechanism to verify the PDB and its corresponding binary.
It is well explained in the debuginfo article.
Points of Interest
Writing text contents and binary data to a single file causes problem. Therefore split up the
log file and module details to two files.
Initially I prepared a single file to hold the module information and log data. But reading binary format provided incorrect data, and I prepared two files,
one for binary writing (log data) and another for text writing (module information).
References
History
- 14-July-2013 - Initial version.
This member has not yet provided a Biography. Assume it's interesting and varied, and probably something to do with programming.


 General
  News
News  Suggestion
  Question
  Bug
Bug  Answer
  Joke
Joke  Praise
  Rant
Rant  Admin
Admin 


