Microsoft Visual studio as an IDE has matured over the years and now as a developer, we are eagerly awaiting the release of Visual Studio 2015 later this year.
In this post, I will be talking about what’s good in Visual studio 2015 CTP 6 (released on Feb 23rd) for debugging and profiling your code. I will be mostly covering the C# features. There are two major enhancements in Visual Studio 2015:
- Debugging UI refresh – Peak implemented
The break-point experience is more enhanced with an option to apply conditions and actions in the same peak screen while setting the break-point.
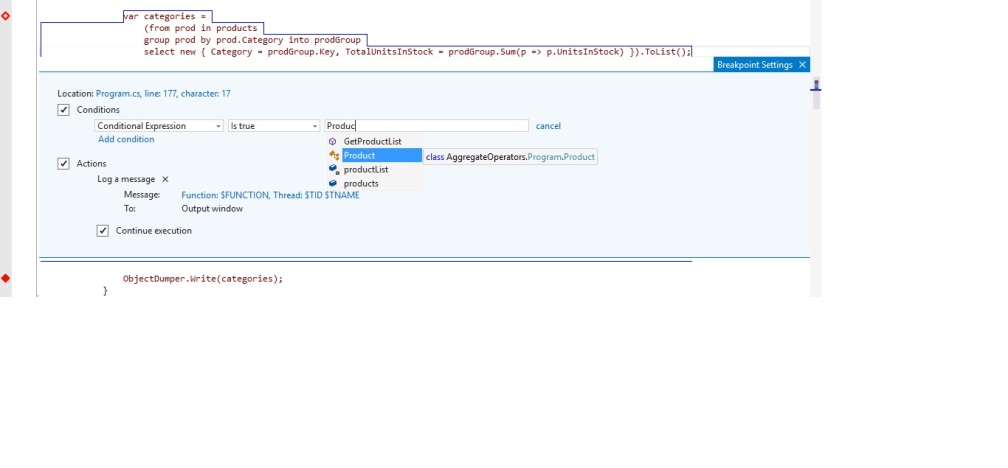
You even have intellisense with applying conditions and actions. Conditions part of debugging peak Windows has three options:
- Conditional Expression – You can apply complex conditional statements using
&& and ||. - Hit Count – Mostly useful when you want to hit a break-point in a
for or a while loop. - Filter is useful when you are remotely debugging or thread/process based debugging.
If the first condition is not satisfied, the other conditions separated by AND will become redundant.
The another happy side of break-point experience is if you by mistake disabled or deleted the break-point.You can still retrieve all your details by UNDOing or through Ctrl+Z. It is not that simple but useful to make our lives happy.
Visual Studio has taken minute care in building break-point UI experience. When you first set a break-point, you see red Circle -> If you set a condition, the red circle has a circle -> If an action is added, it becomes a rhombus. Check this - it is fun to watch.

Actions help you trace the break-point flow by logging information. You can continue tracing through without breaking the execution flow.
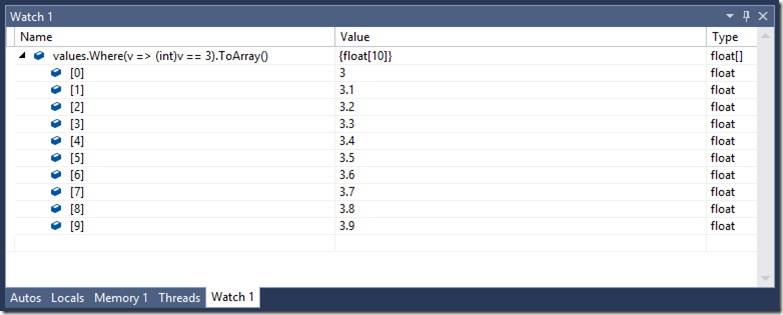
- Support for debugging lambda/LINQ expressions
Till Visual Studio 2013, if you try adding a LINQ or Lambda expression to a quick watch or immediate window to evaluate in runtime, it throws an error saying “The expression is not supported…“. From Visual studio 2015, it's not the case anymore.You can evaluate lambda/LINQ expressions through Watch or Immediate windows.
Limitations As Of Today
As Visual Studio is still in CTP6, there are few limitations as of today:
- Don’t currently support lambda expressions that require calls to native function like LINQ-to-SQL
- ASP.NET 5 with 64-bit IIS and remote debugging ASP.NET 5 is not supported. The debugger will automatically use the old expression evaluator in these cases.
Just to make you more happy,
Microsoft respects its developers feedback and all the features mentioned above are an example of this. If you don’t believe this pic explains it all. This is a survey asking developers about edit & continue features.
Note: The above debugging scenario holds good for C++, Javascript, Python or any other language which Visual Studio supports.
Suggested Read
Visual Studio 2015 CTP 6 Release Notes – Link
CodeProject
Filed under: C#, What's new in .NET Tagged: visual studio 2015 debugging, What's new in Visual studio 2015 


 General
  News
News  Suggestion
  Question
  Bug
Bug  Answer
  Joke
Joke  Praise
  Rant
Rant  Admin
Admin 


