Introduction
Now that the dust has settled and everyone has downloaded and installed Visual Studio 2010 Service Pack 1, it's time to talk about a new feature included that will help Silverlight developers profile their applications. Let’s take a look at what the official documentation says about it:
Performance Wizard for Silverlight – taken from VS2010 SP1 KB.
Visual Studio 2010 SP1 enables you to tune the Silverlight application performance by profiling the code. A traditional code profiler cannot tune the rendering performance for Silverlight applications. Many higher-level profilers are added to Visual Studio 2010 SP1 so that you can better determine which parts of the application consume time.
So, How Exactly Do You Do It?
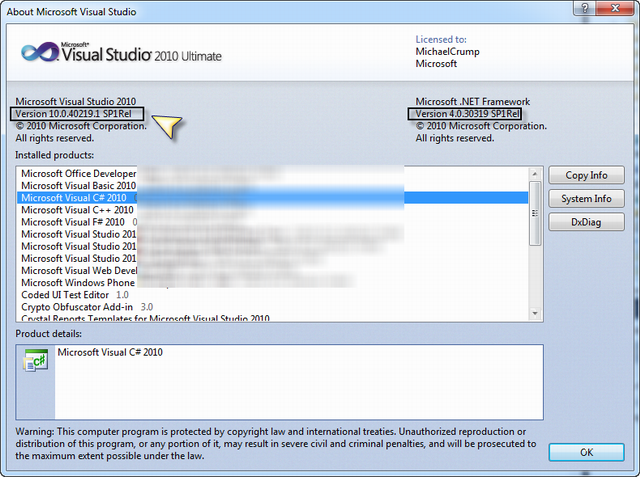
After you finish installing VS2010 SP1, make sure it took by going to Help –> About. You should see SP1Rel under Visual Studio 2010 as shown below:
I’m going to take my hobby Silverlight project that I created a month or so ago. The reason that I’m picking this project is that I didn’t focus so much on performance as it was just built for fun and to see what I could do with Silverlight. I believe this makes the perfect application to profile.
After the project is loaded, click on Analyze, then Launch Performance Wizard.

Go ahead and click on CPU Sampling (recommended).
You will notice that it asks which application to target. By default, it will select the .Web project in a Silverlight application. Go ahead and leave the default Web Project checked.
We are going to leave the client as Internet Explorer.
Now, go ahead and click finish.
Now your Silverlight Application will launch.
While your application is running, you will see the following inside of Visual Studio 2010.
Here is where you will need to attach your Silverlight Application to the web application that is current being profiled. Simply click on the Attach/Detach button below and find your application to attach to the profiler. In my case, I am using Internet Explorer 8 and could find it by the title.
After you close your browser, you will notice it generated a report (files end in a .VSP).
If you click on the .VSP, you will see it generated the following report:
We could turn off “Just My Code”, but it may pick up things that we didn’t want to profile as shown below:
One other feature to note is that you may want to export the data to a CSV or XML. You can do that by looking at the toolbar and clicking the button highlighted below:
Conclusion
The profiler for Silverlight is a great addition to an already great product. So before you ship a Silverlight Application, run it through the profile and see what comes up. Since it's included and free, I can’t see a reason not to do this. Thanks again for reading and I hope you subscribe to my blog or follow me on Twitter for more Silverlight/WP7 fun.
Subscribe to my feed
Michael Crump is a Silverlight MVP and MCPD that has been involved with computers in one way or another for as long as he can remember, but started professionally in 2002. After spending years working as a systems administrator/tech support analyst, Michael branched out and started developing internal utilities that automated repetitive tasks and freed up full-time employees. From there, he was offered a job working at McKesson corporation and has been working with some form of .NET and VB/C# since 2003.
He has worked at Fortune 500 companies where he gained experience in embedded systems design and software development to systems administration and database programming, and everything in between.
His primary focus right now is developing healthcare software solutions using Microsoft .NET technologies. He prefers building infrastructure components, reusable shared libraries and helping companies define, develop and automate process standards and guidelines.
You can read his blog at:
MichaelCrump.net or follow him on Twitter at
@mbcrump.


 General
  News
News  Suggestion
  Question
  Bug
Bug  Answer
  Joke
Joke  Praise
  Rant
Rant  Admin
Admin 


