Introduction
Project Hoshimi is a part of the Imagine Cup challenge. Imagine Cup is the world's premier technical competition for students. In 2006, more than 65,000 students from 100 countries participated, leading the competition to be dubbed the "software development Olympics".
In Project Hoshimi, you will have to create a strategy for a team of virtual "nano bots". They move inside a map (representing a part of the human body) and they score points by doing some actions (such as collecting AZN molecules). Then, your team will have to fight against other teams, on given maps. Like in a video game, you can watch the games using a 2D or 3D viewer. The difference is that you cannot interact with your bots during a game. You have to develop the whole behavior of your bots before you launch the game.
You can download the Project Hoshimi SDK here: http://www.project-hoshimi.com/downloads.aspx.
Abstract
In Project Hoshimi, debugging is very important. First of all, if your program throws any uncaught exception, your nanobots will stop taking orders, and will automatically get stuck. So you have to be very meticulous about null references, index out of bounds...
Secondly, you may use very complex algorithms in your AI program. Since the only output of Project Hoshimi is a viewer program, it is very hard to check that everything is going well in your program.
In this article, I will give you some advices to make debugging and tracing much more easy with Project Hoshimi.
Setting up Visual Studio
The first thing to do is to set up Visual Studio to launch automatically Project Hoshimi after building your DLL.

Open the properties dialog of your project. Then, set the output directory to the players folder of the Project Hoshimi directory. Thus, the DLL file will automatically be copied in the players folder after being built.
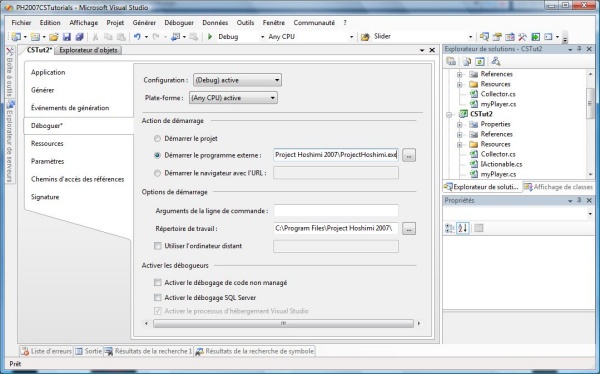
Next, you have to setup Visual Studio to launch Project Hoshimi. If you are not using Visual Studio Express Edition, the following will work:
In the project properties, go to the Debug tab, and select "Start external program" as the start action, and select the path of the ProjectHoshimi.exe file. Then set the "start working directory" to the Project Hoshimi folder (the one that contains ProjectHoshimi.exe). This will prevent you from being asked for your user name each time you launch the Project Hoshimi application.
If you are using Visual Studio Express Edition, you have to edit the *.csproj.usr file and paste this inside:
<Project xmlns="http://schemas.microsoft.com/developer/msbuild/2003">
  <PropertyGroup Condition=" '$(Configuration)|$(Platform)' == 'Debug|AnyCPU' ">
    <StartAction>Program</StartAction>
    <StartProgram>Path to ProjectHoshimi.exe</StartProgram>
    <StartWorkingDirectory>ProjectHoshimi directory</StartWorkingDirectory>
  </PropertyGroup>
  <PropertyGroup Condition=" '$(Configuration)|$(Platform)' == 'Release|AnyCPU' ">
    <StartAction>Program</StartAction>
    <StartProgram>Path to ProjectHoshimi.exe</StartProgram>
    <StartWorkingDirectory>ProjectHoshimi directory</StartWorkingDirectory>
  </PropertyGroup>
</Project>
Replace "Path to ProjectHoshimi.exe" by the ProjectHoshimi.exe path, and "ProjectHoshimi directory" by the directory where ProjectHoshimi.exe is.
Tracing
It is very important to know what is happening during the execution of your AI program. Project Hoshimi features a log system but it is not very convenient. I will now explain how to create a log system easier to use.
First, add this using directive:
using System.Diagnostics;
Then, add this InitLogger static function :
[Conditional("DEBUG")]
public void InitLogger()
{
  Debug.Listeners.Clear();
  Debug.Listeners.Add(new DefaultTraceListener());
  Debug.Listeners.Add(new TextWriterTraceListener("log " +
    DateTime.Now.ToString().Replace(':', '.').Replace('/', '-') + ".txt"));
  Debug.AutoFlush = true;
}
Call it in the constructor of your Player class. Now, you can use the Debug.WriteLine static method to log text in the defined trace listeners. Here, I have 2 listeners:
DefaultTraceListener write the text logged in the Output Window of Visual Studio TextWriterTraceListener write the text logged inside a text file
Try from anywhere in your program:
Debug.WriteLine("Hello world");
Look for a file in the directory of Project Hoshimi with the format "log 30-04-2007 15.31.25.txt". Open it, you should see "Hello world".
You can choose the trace listeners you want to use. The DefaultTraceListener can slow down you program when running with Visual Studio. The TextWriterTraceListener involves few performances loss, and allow you to keep your logs.
The calls of the methods of the Debug class will only be included in the compiled file if the DEBUG compilation flag is set. It is set by default in the Debug configuration, and not set in the Release configuration. So when you will compile the final version of your DLL, just set the current configuration to Release and there will remain no File IO access.
Now, let's add a small function that automatically adds the turn number to the log file:
[Conditional("DEBUG")]
public void LogData(string text)
{
  Debug.WriteLine("[" + this.CurrentTurn.ToString() + "] " + text);
}
This method cannot be static because it uses the CurrentTurn property of the Player object. So you need an instance of the Player object to call it.
This is an example of the output window if you use this function:
Debugging
Sometimes, in you program, you may have to check that everything is running well. In order to notify an incorrect execution of your program, you have several options. You can return an incorrect value from a function or throw an exception. In this article, we are going to use Debugger.Break(). This will cause the execution of the program to break, like if there were a breakpoint. Of course, when running outside of Visual Studio, your DLL will not break.
Let's write the next functions:
[DebuggerHidden]
[Conditional("DEBUG")]
public static void Assert(bool condition, string description)
{
  if (!condition)
  {
    Debug.WriteLine("Assertion has failed");
    if (description != null && description != "")
      Debug.WriteLine(description);
    Debugger.Break();
  }
}
[DebuggerHidden]
[Conditional("DEBUG")]
public static void Assert(bool condition)
{
  Assert(condition, "");
}
Let's assume that in some part of your program, an integer variable must be positive or null. You can use this Assert function to ensure it is not:
Assert(i >= 0, "i should not be negative");
In Debug mode, when i is positive, this line will be transparent and when i is negative, the debugger will stop, and you will have access to the values of all local variables through Visual Studio, facilitating debugging. Besides, you will be able to check the call stack.
In Release mode, this line of code won't even be compiled (because of the [Conditional("DEBUG")] attribute), so you won't have any performance loss. Additionally, this function can write a message in the log.
Exceptions
If your program raises an uncaught exception, the remaining code will not be executed and you bots won't do anything during this turn. It is very important to avoid raising uncaught exceptions.
First, open in the Debugging / Exceptions dialog of Visual Studio. Make sure to check all the CLR Exceptions.
During development, I advice you not to use try / catch statements, because your program will stop on any exception risen, and you will be able to debug. For the final version of your program, it can be a good idea to add some try / catch statements to protect your program. But remember that this can slow down your program.
Conclusion
Now, you should be able to debug properly your program. A good way to test your program is to use PHAutomate to play automatically several games on several maps. Then you can study scores and log files to search for an abnormal behavior.
Good luck!
History
This article was published on May 11th, 2007.


 General
  News
News  Suggestion
  Question
  Bug
Bug  Answer
  Joke
Joke  Praise
  Rant
Rant  Admin
Admin 


