Introduction - About MSChart Extension
MSChart Extension is an extension package created to provide additional features and functions to Microsoft Chart (MSChart) control. This control is released under MIT license.
Also available in NuGet and GitHub.
GitHub: https://github.com/Code-Artist/MSChartExtension
Background
Microsoft Chart (MSChart) in Visual Studio is a great Windows Forms (WinForms) controls to create a chart for a standalone application. However, there are several features that could be added and improved to make this control more user friendly.
Zooming and panning are two common features for chart when dealing with large amount of data. Unfortunately, there is no easy way to have these two features enabled with MSChart. Although there is a built in Zoom control, it is not very user friendly which is described below. On the other hand, panning is not available. I searched around the web, but didn't find any reliable solutions.
I tried to implement these two features in MSChart by writing custom code and YES it is possible. Instead of copying and pasting the same piece of code over and over again to every single project that I need, I created this MSChart Extension class which put all these additional features in a separated assembly which can be simply added as reference when needed.
Features List
- Fast Clear Data
- Windowed Zoom in and Zoom Out
- Pan
- Show / hide series
Fast Clear Data
MSChart has a known problem which impacts most of the users which is the speed of clearing data points. This becomes worse when dealing with a large amount of data. The workaround for this solution had been published by Microsoft and users to fix this problem. See the previous post: Speedup MSChart for more details.
myChart.Series[0].ClearPoints();
Windowed Zoom
This is an improved version of zoom control with zoom out (full view) instead of using built in zoom control in MSChart. The main reason for recreating this feature is because zooming out is really a pain where I need to zoom out each axis separately by clicking a button on the axis by number of times that I zoomed in. Moreover, the built in controls do not seems to work well with annotations.
Notes: Zoom out function is available in pop up menu when chart is zoomed.
Pan
Panning allows the user to move zoomed window using mouse. This is much better than moving the horizontal and vertical scroll bar.
Show / Hide Series
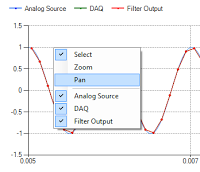
Sometimes, it is necessary to plot chart with multiple series for data comparison. However, it would not be easy to visualize the data for each individual series when we have multiple series overlapping each other. Show and hide series function provide a flexibility to hide each series as you wish. MSChart extension will automatically detect number of series used in chart, no setup is required to use this feature. Each series can be hidden / shown from context menu.
Using MSChart Extension
To use this extension package, simply add MSChart assembly to reference of the project. Additional features and dedicated context menu can be enabled by the following function call.
private void AttachChartControl()
{
myChart.EnableZoomAndPanControls(ChartCursorSelected, ChartCursorMoved);
}
private void ChartCursorSelected(double x, double y)
{
txtChartSelect.Text = x.ToString("F4") + ", " + y.ToString("F4");
}
private void ChartCursorMoved(double x, double y)
{
txtChartValue.Text = x.ToString("F4") + ", " + y.ToString("F4");
}
ChartCursorSelected and ChartCursorMoved are two optional callbacks to notify parent when chart coordinate changed. ChartCursorSelected will be called when a point in chart area is selected whereas ChartCursorMoved will trigger when mouse is moved in chart area. x and y values in these two callbacks are values for X-Axis and Y-Axis. It is hard coded to use primary axis at this moment.
This operation is reversible by calling the following function:
myChart.DisableZoomAndPanControls();
MSChart Extension comes with a built in pop up menu which allows the user to use features such as zoom and pan controls during run-time. All functions such as zoom, pan, select and series hide / show can be accessed from context menu. This context menu is shown when right click mouse in chart with Zoom and Pan controls are enabled as shown above.

Future Improvement
- Add an option to select between primary / secondary axis for Select tool and callback functions.
- Append MSChart Extension's context menu to user defined context menu if exists.
- Implement 2 cursors to calculate difference between 2 points.
Version History
- 02/04/2012 Original document
- 03/04/2012 Reformat
- 04/04/2012 Added description to call back functions and future improvement list
- 24/04/2012 Published as NuGet Package


 General
  News
News  Suggestion
  Question
  Bug
Bug  Answer
  Joke
Joke  Praise
  Rant
Rant  Admin
Admin 


