Introduction
Sometimes it's the sizzle that sells an idea rather than the idea itself. On a recent consulting project, bidders were asked to supply a simple program
that would give the prospective client some idea of what the project results would look like. All they asked for was a simple program that would display the
supplied data series in a way that was useful to the management. For me, using a 3D chart instead of a simple 2D chart was
the sizzle for the client. Making the chart rotatable in 3D just added some aroma to the sizzle.
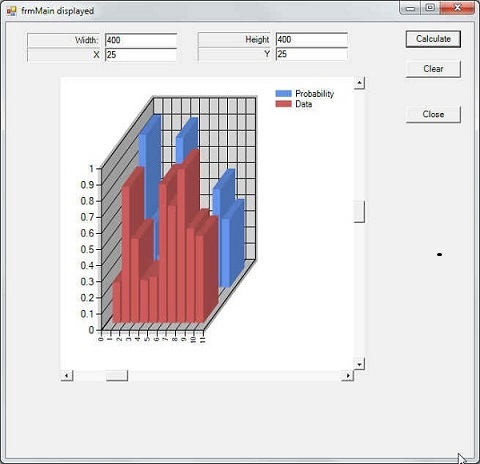
Figure 1 shows a demo use of the chart class used in this article. The class is built on Microsoft's Chart control, which is integrated into Visual Studio.
While the language I used is C#, the basic chart class is available for all of the Visual Studio languages. The code is pretty straightforward,
so I don't think you would have any difficulty converting it to some other language.
Background
While 3D charts are built into the Chart control, adding the scrollbars makes the chart a little more interesting.
If the user drags the vertical scrollbar control, the graph's inclination angle is changed. The scrolling is surprisingly smooth.
The horizontal scrollbar rotates the graph through 180 degrees. While also smooth, there are some minor hiccups at 45 and 90 degrees as the graph's perspective changes.
There are roughly a bazillion properties and methods for the basic Microsoft chart control, and my class only uses a few of them. You can extend
the class by adding more properties and methods as you see fit.
Using the code
The following code fragment is from Calculate button's click even in the demo program shown in Figure 1. (I have omitted the numeric checks here, but they are in the demo source code.)
try
{
myChart = new cls3DChart(width, height, x, y);
myChart.SeriesSize = 10;
myChart.NumberOfSeries = 2;
myChart.CurrentSeriesName = "Probability";
GenerateTestData(myChart.SeriesSize);
this.Controls.Add(myChart);
myChart.InitializeChart();
myChart.SetSeriesData(series);
GenerateTestData(myChart.SeriesSize);
myChart.SeriesColor = Color.IndianRed;
myChart.CurrentSeriesName = "Data";
myChart.SetSeriesData(series);
}
catch (Exception ex)
{
MessageBox.Show("Something went terribly wrong: " + ex.Message);
}
Listing 1. Part of the Calculate button click event.
The declaration of myChart appears earlier in the class using class scope. The
definition of myChart is deferred until the click event is
sensed because we need the size and coordinates passed into the "cls3DChart"'s
constructor. In that class, the Microsoft chart control is placed on a panel
control. At runtime, the "width" and "height" arguments determine the size of
the panel and the chart control. The "x" and "y" coordinates are used to pin the
upper-left corner of the control on whatever form you may be using to host the
chart. The code then sets a few of the chart's property members and then
generates some random numbers by a call to GenerateTestData(). (The function
simply generates a series of random numbers and stores them in an array named series. The source code for this method is also in the demo file.)
The code then adds the newly-defined control (myChart) to the
form via the Add(myChart) method call. Most of the work is done
with the call to InitializeChart(), the code for which appears in Listing 2.
Note that the file holding the cls3DChart code was added to the project using the "Add User Control" option from the "Project" menu.
This gives you a "form" surface on which to draw the new control.
public void InitializeChart()
{
chartMain.ChartAreas[0].Area3DStyle.Enable3D = true;
chartMain.ChartAreas[0].Area3DStyle.PointDepth = chartDepth;
Axis axisY = chartMain.ChartAreas[0].AxisY;
Axis axisX = chartMain.ChartAreas[0].AxisX;
axisY.Interval = yInterval;
axisX.Interval = xInterval;
myVScrollBar.Scroll += new ScrollEventHandler(this.myVScrollBar_Scroll);
myHScrollBar.Scroll += new ScrollEventHandler(this.myHScrollBar_Scroll);
myVScrollBar.Height = height;
myVScrollBar.Width = scrollBarWidth;
myHScrollBar.Height = scrollBarWidth;
myHScrollBar.Width = width;
myHScrollBar.Location = new System.Drawing.Point(0, height);
myVScrollBar.Location = new System.Drawing.Point(width, 0);
myVScrollBar.SetBounds(width, 0, scrollBarWidth, height);
myHScrollBar.SetBounds(0, height, width, scrollBarWidth);
myVScrollBar.Maximum = 90;
myVScrollBar.Minimum = -90;
myVScrollBar.SmallChange = smallDeltaY;
myVScrollBar.LargeChange = largeDeltaY;
myVScrollBar.Value = -15;
myHScrollBar.Maximum = 180;
myHScrollBar.Minimum = 0;
myHScrollBar.SmallChange = smallDeltaX;
myHScrollBar.LargeChange = largeDeltaX;
myHScrollBar.Value = 15;
panel1.Controls.Add(myVScrollBar);
panel1.Controls.Add(myHScrollBar);
}
Listing 2. Initializing the control.
The code is fairly straightforward, setting the vertical and horizontal scrollbar objects' properties. Note that the location of the scrollbars is tied
to the panel control. In other words, if the chart control and panel control are 400 pixels wide and 300 pixels high, the statements:
myHScrollBar.Location = new System.Drawing.Point(0, height);
myVScrollBar.Location = new System.Drawing.Point(width, 0);
place the upper-left corner of the horizontal scrollbar at coordinates 0,300 and the vertical scrollbar at 400, 0. These coordinates place the scrollbars
just on the edge of the panel control. The calls to:
myVScrollBar.SetBounds(width, 0, scrollBarWidth, height);
myHScrollBar.SetBounds(0, height, width, scrollBarWidth);
simply define the size of the scrollbars. The rest of the code sets various properties to values that I used for the client demo. You can add
properties and property methods to the class for those properties you think you may need to change at runtime for your purposes. The statements:
panel1.Controls.Add(myVScrollBar);
panel1.Controls.Add(myHScrollBar);
add the two scrollbars to the panel control.
The code in Listing 3 shows how the new event handlers are written.
private void AddMyScrollEventHandlers()
{
myVScrollBar.Scroll += new ScrollEventHandler(this.myVScrollBar_Scroll);
myHScrollBar.Scroll += new ScrollEventHandler(this.myHScrollBar_Scroll);
}
private void myVScrollBar_Scroll(Object sender,ScrollEventArgs e)
{
if (myVScrollBar.Value > inclineValue)
{
chartMain.ChartAreas[0].Area3DStyle.Inclination = (int)myVScrollBar.Value;
inclineValue += (int)myVScrollBar.SmallChange;
}
else
{
chartMain.ChartAreas[0].Area3DStyle.Inclination = (int)myVScrollBar.Value;
inclineValue -= (int)myVScrollBar.SmallChange;
}
}
Listing 3. Event handler code.
Only the vertical scroll event is shown since the horizontal control works
much the same way. When a scroll event is sensed, the value of the vertical
scrollbar is compared to the inclineValue property, which I have defined to be -15 by default. (If the initial value were set to 0, it would be a "straight-on" view
of the graph and a little less interesting.) The range of values for the scrollbar is plus and minus 90 degrees. With the initial value of the scrollbar at -15,
the graph is initially tilted downwards by 15 degrees. If the users clicks above the scrollbar or drags it upwards, the vertical scroll event is fired and
the event handler is called. If you trace the logic, you can see that increasing the value moves the scrollbar upward and moves the chart accordingly.
If you look at the class code, you'll see virtually the same code for the horizontal scrollbar.
The data is placed on the chart by calling the SetSeriesData() method in the chart class. The code appears in Listing 4.
public void SetSeriesData(double[] sentData)
{
int i;
Series series = new Series();
series.Name = currentSeriesName;
series.Color = seriesColor;
series.ChartType = SeriesChartType.Column;
for (i = 0; i < seriesSize; i++)
{
series.Points.Add(sentData[i]);
}
chartMain.Series.Add(series);
currentSeries++;
}
Listing 4. Adding data to the chart.
The method begins by defining a new data Series named "series". Note that
there are numerous properties available as part of the Series class, but we're
only using the Name, Color, and ChartType
properties. While I have made the name of the data series and its corresponding
color properties of the chart class, I have hard-coded the type to be a Column
chart. You could make this a property if you need to make it changeable at
runtime. The number of data points to be added to the series is set by seriesSize,
which you can see near the top of Listing 1 has been set to 10. The code then
just iterates through the data and adds it to the chart via the chartMain.Series.Add() method call. That's pretty much all there is to it.
During the process of writing the code for the control, it amazed me how scattered the information on the Microsoft Chart control is. It was also
difficult to find demo code for the 3D version of the control that used scrollbars. (I couldn't find one.) At least the demo code here brings it all
together in one place. If you single-step through the code, you'll be able to figure out how all the pieces-parts fit together. If you find bugs or make
enhancements, I hope you'll share those with the rest of us.
History
- Initial code written Feb. 3, 2013.
Dr. Purdum is a retired professor from Purdue University's College of Technology and author of 17 programming books. He continues to do consulting and writing, and is also interested in programming embedded systems.


 General
  News
News  Suggestion
  Question
  Bug
Bug  Answer
  Joke
Joke  Praise
  Rant
Rant  Admin
Admin 


