Introduction
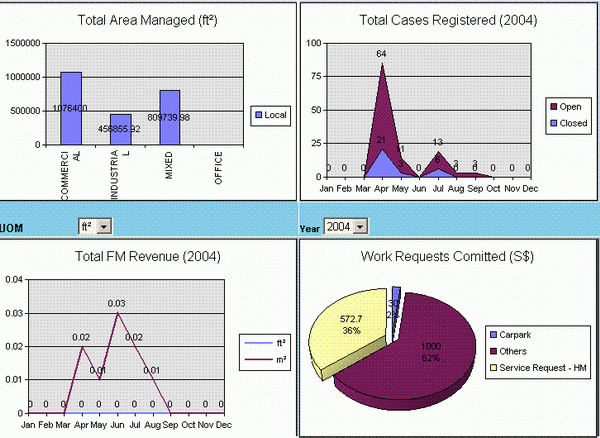
There are quite a lot commercial or free charting controls available in the market. However, most of the charting requirements are presented with Microsoft Excel charts. In other words, if we can utilize the rich features offered by MS OWC (Office Web Component) including the office charting support, we shall be able to present Microsoft Office charts in web pages.
By employing MS OWC technology, there are basically two approaches to implement the charting control, i.e., server-driven and or client-driven. The server-driven approach is to render the chart at the server side with OWC COM class, through .NET interop. Another one is using OWC ActiveX object. The 2nd approach requires the Office OWC support at the client side and thus incurs the license issue. In this ChartFactory custom control, the server-driven model is adopted. As to how to install the OWC license on the server side, please refer to Microsoft site.
Using the code
Step 1: Adding Control Reference
To use the custom control, you can include the assembly from the toolbox bar in your VS.NET IDE (Add/Remove items -> locate the assembly -> OK). Once done, you can drag and drop that control into ASP.NET forms in any ASPX page or ASCX page.
Step 2: Prepare Chart Data
In order to render the charting, you will have to fill the DataSet first that is required by ChartFactory.AddChartData method. The DataSet instance can only have a single table that must contain three columns having names: "Series", "Group" and "Value". You shall not change the column names as they are referenced by ChartFactory control.
As the ChartFactory doesn't get any chart type information from the DataSet, there shall be some ways to pass the chart type information. It is achieved by passing a parameter ChartFactory.AddChartData method, which however has three types of method signatures:
ChartFactory.AddChartData(DataSet dsChart)
It will choose the DefaultChartType that is set through designer property builder. The chart type will be applied to all series if there are more than one series in the chart.
ChartFactory.AddChartData(DataSet dsChart, ChartTypeEnum chartType)
All series within the chart will have the same chartType.
ChartFactory.AddChartData(DataSet dsChart, Hashtable SeriesChartType)
Each series of the chart may have a different ChartType. Therefore, a mapping between chart series name to chart type are specified in the HashTable.
The ChartFactory.AddChartData method can be called more than once such that more than one chart will be rendered within a single chart space (a term used by MS), and they will all appear in a single GIF image displayed in client HTML.

Render the Chart
Finally, it is to invoke the chart rendering from the application code by calling DataBind() method of the ChartFactory control. The reason why it has to be explicitly invoked is to give more control to the application developers so that they can decide when and where to invoke. Normally, on Page_Load event, ChartFactory.DataBind() has to be called for chart rendering. If there is any postback event, and that would change the DataSet of the ChartFactory or any other properties of it, during the postback event this method will have to be called again.
If any other questions or programming extension requirements, please send to my email box. Thanks. I do all this for the sake of sharing something that can be useful to you.
Appendix: CharTypeEnum Definition
#region CharTypeEnum
public enum ChartTypeEnum
{
Area = 1,
AreaStacked,
AreaStacked3D,
BarStacked,
Bar3D,
Column,
ColumnStacked,
Column3DStacked,
Doughnut,
Line,
Line3D,
LineStacked,
Pie,
Pie3D,
PieExploded,
Pie3DExploded,
RadarLine,
ScatterLine
}
#endregion
 General
  News
News  Suggestion
  Question
  Bug
Bug  Answer
  Joke
Joke  Praise
  Rant
Rant  Admin
Admin 


