Introduction
This article discusses how to create organigrams also known as organograms or organizational charts. An organigram is the departmental structure of an organization and their hierarchal relations. In this article, we will discuss how to dynamically generate a VISIO file containing the organizational chart of your organization while reading data from a data source (supposedly you have your organization structure stored in a database or other data source).
Background
To know how to automate VISIO 2007, the best thing to do is to install VISIO 2007 SDK. You can download the SDK from Microsoft site from this link.
VISIO SDK contains the sample code in VB and C# on how to use VISIO objects and automate VISIO drawings.
Using the Code
The source code is in the Class Library Ids.OrganogramDesigner. This library contains the class Box. The class Box represents one department or entity in your organization. The class Box contains properties that can be manipulated and reflected on the orgnigram drawing. The following is the list of properties:
Name: The name to appear on the organigram box Parent: The parent Box to create a hierarchy between entitiesLevelNumber: The level number of the box. Level Number 0 is the top level (the root). As the level number increases, the box goes down to the hierarchy. DisplayOrder: Used to order boxes on the same level BackColor: The back color (or fill color) used for the boxForeColor: The fore color (or pen color) used for the text in the boxWidth: The width of the box (can be changed if you want to use very small boxes in case of large organigrams)Height: The height of the box (can be changed if you want to use very small boxes in case of large organigrams)Hyperlink: A URL that when clicking on a box will direct you to the page
Then we have the class Designer. The class Designer when instantiated needs to be assigned the following properties:
VisioTemplatePath: which should be in program files folder --> Microsoft Office --> Office12 --> 1033 --> ORGCH_M.VSTSaveFolder: The path where to Save the generated Visio files. The path is only the folder path. The files are generated with a GUID.
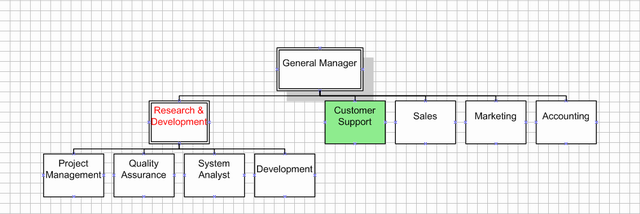
List<Box> boxes = new List<Box>();
boxes.Add(new Box("1", "General Manager"));
boxes[0].Type = BoxTypes.Executive;
boxes.Add(new Box("2", "Research & Development", "1", 1));
boxes.Add(new Box("3", "Customer Support", "1", 1));
boxes.Add(new Box("4", "Sales", "1", 1));
boxes.Add(new Box("5", "Marketing", "1", 1));
boxes.Add(new Box("6", "Accounting", "1", 1));
boxes[1].Type = BoxTypes.Manager;
boxes[1].ForeColor = Colors.Red;
boxes[2].BackColor = System.Drawing.Color.LightGreen;
boxes.Add(new Box("9", "Project Management", "2", 2));
boxes.Add(new Box("10", "Quality Assurance", "2", 2));
boxes.Add(new Box("11", "System Analyst", "2", 2));
boxes.Add(new Box("12", "Development", "2", 2));
Ids.OrganogramDesigner.Designer designer = new Designer();
designer.Boxes = boxes;
designer.SaveFolder = @"d:\Projects\DrawVisio\";
designer.VisioTemplatePath = @"C:\Program Files
(x86)\Microsoft Office\Office12\1033\ORGCH_M.VST";
designer.GenerateDiagram();
The output of GenerateDiagram is the following:
Further Explanation
Here I would like to explain how the GenerateDiagram() method works. The most important thing to know is the following:
How to Create a New VISIO Document
Microsoft.Office.Interop.Visio.Application application =
		new Microsoft.Office.Interop.Visio.Application();
application.Visible = false;
Microsoft.Office.Interop.Visio.Document doc = application.Documents.Add(templatePath);
Microsoft.Office.Interop.Visio.Page page = application.Documents[1].Pages[1];
How to Get the Width and Height of the Sheet You are Working On
double xPosition = page.PageSheet.get_CellsU("PageWidth").ResultIU;
double yPosition = page.PageSheet.get_CellsU("PageHeight").ResultIU;
We are using this information about the sheet width and height to know where to place the boxes. We are putting the root boxes in the middle of the sheet by dividing the sheet width by the number of roots. Also we are subtracting from the yPosition the level number so that the boxes with increasing level number will get a lower position on the chart.
How to Create a Shape and Place it on the Chart (Drop it)
Microsoft.Office.Interop.Visio.Master position = doc.Masters.get_ItemU("Position");
Microsoft.Office.Interop.Visio.Shape shape = page.Drop(position, xPosition, yPosition);
How to Set the Shapes Properties
shape.Text = box.Name;
if (!String.IsNullOrEmpty(box.HyperLink.Trim()))
{
Hyperlink link = shape.Hyperlinks.Add();
link.Address = box.HyperLink;
}
shape.get_CellsSRC(
(short)Microsoft.Office.Interop.Visio.VisSectionIndices.
visSectionObject,
(short)Microsoft.Office.Interop.Visio.VisRowIndices.
visRowXFormIn,
(short)Microsoft.Office.Interop.Visio.VisCellIndices.
visXFormWidth).ResultIU = box.Width;
shape.get_CellsSRC(
(short)Microsoft.Office.Interop.Visio.VisSectionIndices.
visSectionObject,
(short)Microsoft.Office.Interop.Visio.VisRowIndices.
visRowXFormIn,
(short)Microsoft.Office.Interop.Visio.VisCellIndices.
visXFormHeight).ResultIU = box.Height;
shape.Characters.set_CharProps(
(short)Microsoft.Office.Interop.Visio.
VisCellIndices.visCharacterColor,
(short)Utilities.GetVisioColor(box.ForeColor));
shape.get_CellsSRC((short)VisSectionIndices.visSectionObject,
(short)VisRowIndices.visRowFill,
(short)VisCellIndices.visFillForegnd).FormulaU =
"RGB(" + box.BackColor.R.ToString() + "," + box.BackColor.G.ToString() + ","
+ box.BackColor.B.ToString() + ")";
connectWithDynamicGlueAndConnector(shape, childShape);
Connecting the shapes is done using the method connectWithDynamicGlueAndConnector(). This method accepts two parameters, the parent shape and the childShape and will create the connector between. This method is the exact one found in VISIO SDK.
Publishing
After creating and setting the Properties of the Shape, now it's time to connect the shapes.
After creating the VISIO file, you need to publish it. I am publishing it on web using VISIO Viewer. You can download VISIO Viewer 2007. The Visio 2007 Viewer allows anyone to view Visio drawings and diagrams (created with Visio 5.0, 2000, 2002, 2003, or 2007) inside their Microsoft Internet Explorer version 5.0 or later Web browser.
History
- 16th September, 2010: Initial post


 General
  News
News  Suggestion
  Question
  Bug
Bug  Answer
  Joke
Joke  Praise
  Rant
Rant  Admin
Admin 


