Microsoft teamed up with a major independent software vendor (ISV) to identify and improve the vendor’s DevOps practices, with a focus on monitoring. Together they came up with a solution that provides multiple DevOps benefits, including Application Performance Monitoring, Automated Deployment, and Usage Telemetry.
Customer profile
The ISV is a leading maker of software that enables customers to build and manage websites and mobile sites, run email campaigns, and publish content to social forums from a single interface.
It has increased its investment in cloud services and is moving new and existing offerings to a Software as a Service (SaaS) model where it is hosting the system for its customers. This introduces great potential as well as new challenges.
Problem statement
Although this ISV has no official DevOps strategy, employees have been using several DevOps practices such as Continuous Integration and Delivery, Infrastructure as Code, and Automated Testing. Benefits include better transparency of processes and faster deliveries.
However, even with these DevOps practices in place, they believed there was room for improvement. With the move to cloud services, the load on operations was increasing as customers onboarded their SaaS offerings.
With this in mind, they joined forces with Microsoft in a Hackfest to identify potential improvement points in the SaaS pipeline.
Solutions, steps, and delivery
To begin, a joint team from Microsoft and the ISV used Value Stream Mapping (VSM), a means of identifying strengths and potential improvement points in an application pipeline. This practice comes out of Lean Manufacturing and is easily adopted into IT service delivery to optimize processes and improve collaboration.
The focus of the VSM exercise is to map out what must take place in order to transform an idea into a product or service, noting all the necessary steps that need to be taken by product owners, development, test, operations, and others.
This exercise should map out the average work-and-wait time between these different steps in an application development pipeline, showing a clear picture of how long each step takes to complete and how long before the next step can begin.
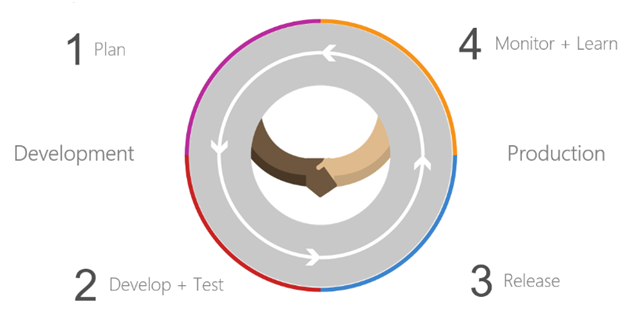
The team performed the Value Stream Mapping according to traditional Application Lifecycle Management (ALM) principles that cover Plan, Develop/Test, Release, and Monitor/Learn. By including DevOps practices, they could take it to the next level.
From this exercise, they learned that their current processes enabled them to deploy new features and fixes to production in less than 9 days if prioritized and that they had an average cadence of 26 days for deploying from regular sprints.
The whiteboard screenshot shows the outcome of the VSM exercise for a specific SaaS application. Using more traditional techniques like a whiteboard for the VSM work contributed to a great team experience and very visible, tangible results.

Monitor and Learn
The Value Stream Mapping revealed an opportunity for the ISV to improve how it monitors the solution and how it collects and uses feedback. It showed a lack of feedback from a service running in production to both product management and development. The Microsoft team recognized this as an issue because, in running online services, they’ve learned that understanding how people use those services is crucial to adoption and should be considered when deciding on new features. Another important implementation of monitoring is to give the needed information at the right time. This is very relevant when troubleshooting an application, and it is critical to providing the right information to the team working on bug fixes.
The ISV was monitoring the online service only for an up/down status and was collecting only very basic usage telemetry. With this conclusion, the hack team focused on two areas of monitoring:
- Application Performance Monitoring. They wanted to get a better understanding of the running service by monitoring the performance of the application. They had learned from DevOps that understanding how apps are running is crucial to decreasing the time to recovery in case of a breakdown. It also helps ensure that users not only can access an application, but get the expected performance and experience from it as well. With Application Performance Monitoring, a team can look deep into an application and collect detailed performance data and application exceptions, which engineers can use in optimizing and troubleshooting the service—providing the right information at the right time to the team working to fix an issue.
- Usage Telemetry. The team planned to collect Usage Telemetry to gather data about user behavior and application feature usage. DevOps has shown the importance of using the right data when making decisions about new and existing features in an application. This data is collected by monitoring usage of the running application and then analyzing it to understand how best to improve the app.
The team decided to hack a solution that would strengthen the feedback loop (Monitor and Learn) and provide both Usage Telemetry and deep application monitoring.
The Hackfest
The two companies chose to use Visual Studio Application Insights, an Azure application telemetry service, to understand the usage, health, and availability of the ISV’s services.
Application Insights offers automated web tests that can run from any Azure datacenter in the world to ensure availability for a variety of markets. A web test can easily be created from the portal. This works great for simple scenarios; however, in this case, the number of tests and properties of a test were very fluid and could change per tenant. Because of this, the hack team needed to be able to describe web tests programmatically.
Overview of the solution
By using Application Insights, the team was able to describe web tests by an XML schema.
<WebTest Name="WebTest1" Id="0000-0000-0000-0000" Enabled="True" CssProjectStructure=""
 CssIteration="" Timeout="0" WorkItemIds="" xmlns="http://microsoft.com/schemas/VisualStudio/TeamTest/2010"
 Description="" CredentialUserName="" CredentialPassword="" PreAuthenticate="True"
 Proxy="default" StopOnError="False" RecordedResultFile="" ResultsLocale="">
  	<Items>
	<Request Method="GET" Guid="a5f10126-e4cd-570d-961c-cea43999a200"
	 Version="1.1" Url="http://microsoft.com" ThinkTime="0" Timeout="300"
	 ParseDependentRequests="True" FollowRedirects="True" RecordResult="True"
	 Cache="False" ResponseTimeGoal="0" Encoding="utf-8" ExpectedHttpStatusCode="200"
	 ExpectedResponseUrl="" ReportingName="" IgnoreHttpStatusCode="False" />
  	</Items>
</WebTest>
For automating the deployment of web tests, Azure Resource Manager can deploy Application Insights test resources that are the type: Microsoft.Insights/webtests.
An Azure Resource Manager Application Insights might look like this:
{
"name": "Test1",
"apiVersion": "2015-05-01",
"type": "microsoft.insights/webtests",
"location": "Central US",
"tags": {
"[concat('hidden-link:', resourceId('microsoft.insights/components/appinsightsresource')))]": "Resource"
},
"dependsOn": [
"[concat('microsoft.insights/components/', parameters('appName'))]"
],
"properties": {
"Name": "Test1",
"Description": "A healthy descriptive piece of text",
"Enabled": true,
"Frequency": 300,
"Timeout": 30,
"Kind": "ping",
"Locations": [{ "Id": "us-il-ch1-azr" }],
"Configuration": {
"WebTest": "<WebTest Name="WebTest1" Id="0000-0000-0000-0000" Enabled="True" CssProjectStructure=""
CssIteration="" Timeout="0" WorkItemIds="" xmlns="http:
Description="" CredentialUserName="" CredentialPassword="" PreAuthenticate="True" Proxy="default"
StopOnError="False" RecordedResultFile="" ResultsLocale=""><Items><Request Method="GET"
Guid="a5f10126-e4cd-570d-961c-cea43999a200" Version="1.1" Url="http://microsoft.com" ThinkTime="0"
Timeout="300" ParseDependentRequests="True" FollowRedirects="True" RecordResult="True" Cache="False"
ResponseTimeGoal="0" Encoding="utf-8" ExpectedHttpStatusCode="200" ExpectedResponseUrl=""
ReportingName="" IgnoreHttpStatusCode="False" /></Items></WebTest>"
},
"SyntheticMonitorId": "Test1"
}
}
A guide on Dynamic Web Test Creation is available at Azure Resources. To get the Azure Resource Manager (ARM) template, go to the Azure Quickstart Templates gallery.
Conclusion
When the Hackfest ended after five days, the team had built a solution that can be used across most of the ISV´s online services and deployed as part of their existing methods.
By adding a strong monitoring solution, they will be able to collect usage data from their online services to use in evaluating upcoming improvements to their applications. This closes the incomplete feedback loop that was discovered by the Value Stream Map exercise.
Development and operations can benefit from this solution on several levels:
- Faster deployment. They can achieve this by incorporating monitoring needs in the planning phase and developing them together with other features. Then when operations receive new builds to deploy, testing already will be defined and deployment will be automated via ARM.
- Better communication. By having a strong monitoring solution, the development and operations teams can communicate better when bugs are found and fixes are needed. The Mean Time to Recovery (MTTR) can be reduced when development and operations get a clear picture of what is failing or performing poorly.
- General application. By generalizing the new solution, it can be used across different services and be part of the ISV´s application foundation. This can help all teams and reduce the time spent to develop and maintain the monitoring solution in the future.
Resources
Rasmus Hald is a Technical Evangelist at Microsoft, located in Denmark.


 General
  News
News  Suggestion
  Question
  Bug
Bug  Answer
  Joke
Joke  Praise
  Rant
Rant  Admin
Admin 


