We all know unit testing is an important aspect of developing and verifying the code we write in our .NET IDEs. We want our tests to cover the smallest isolated segments of code in our .NET solutions and to cover as many code paths as possible to ensure our code behaves as expected.
Sometimes testing the logic of the code is not enough. While memory profilers are not the tools most of us use every day, we should use them more often. Usually, they only get used later in the development process when things go wrong or to fix bugs. What if we could leverage a memory profiler in our unit tests? Then we could have the peace of mind to know that our code is not only written well logically but also uses memory efficiently.
When to use dotMemory Unit?
Most developers will start up a memory profiler when there is a problem. We should make a plan on using memory profilers throughout the development process and not just when we think we have found a bug involving a memory leak in our code. That is a very valid reason, but it is like treating a sick person with medicine. Why not subscribe to preventive care as we do in our own lives? We should plan, exercise and be disciplined with testing our code to make sure that our applications consume and use the expected memory.
What should we test with dotMemory Unit? First, we should identify the areas of the applications that we know consume the largest amount of memory. We should also test those areas that need to dispose of a large number of objects like loops involving data queries from our data sources. Last we should check how our applications use a lot of memory for data traffic. All of our tests can finally have their memory snapshots saved at the end of the unit tests runs for us to examine the consumption patterns and behaviors.
We can also use dotMemory Unit to test to see if certain types of objects are being instantiated and used in code that our unit tests are covering. Also, we can use dotMemory Unit to test the differences between a saved snapshot and the current memory usage.
As we have seen, there are quite a few areas during the entire development process that can benefit from using dotMemory Unit enhanced unit tests. In addition to using dotMemory Unit for unit tests, the tool also can support the need for functional and integration testing during the development process. Now let’s look at how we create and use these special unit tests.
How dotMemory Unit works
We will next look at how to work with dotMemory Unit in our .NET Framework and .NET Core solutions and projects. There are two ways to include dotMemory Unit in our .NET solutions. The first is to install the dotMemory Unit NuGet package into our project. In Visual Studio we can add the package through the Package Manager Console using the following command:
Install-Package JetBrains.DotMemoryUnit
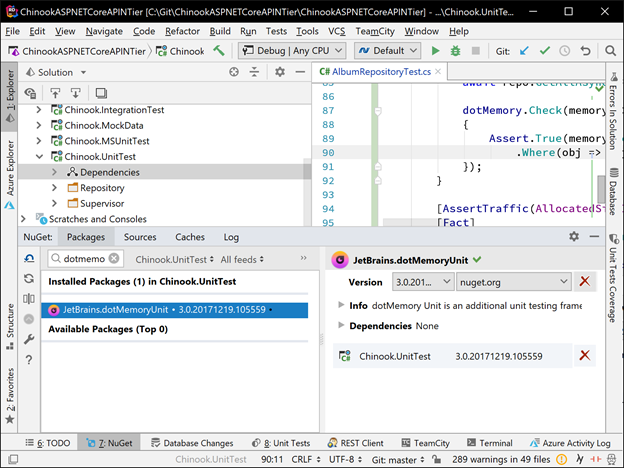
In Rider IDE, we can add the JetBrains.DotMemoryUnit package using the NuGet window as shown below.
We can also download the necessary files (including the standalone dotMemory launcher) and include and reference the libraries from our .NET solutions. You can find the download at the dotMemory Unit homepage https://www.jetbrains.com/dotmemory/unit/.
We can use most unit testing frameworks from the ReSharper’s Test Runner in ReSharper and the Rider with dotMemory Unit including xUnit, NUnit and MSTest. We can also run our unit tests from JetBrains’ dotCover product. Just understand that dotMemory Unit is not a test runner on its own and we will use it in cooperation with the supported unit testing frameworks.
The features of dotMemory Unit go beyond just adding new capabilities in unit tests. After the unit tests have been run, we can save the memory profile snapshot that can be used to compare to future unit tests and also can be open and analyzed in JetBrains dotMemory tool. We can also run the unit tests created with dotMemory Unit tests from the standalone dotMemory Unit executable. This will allow us to include our tests in our DevOps workflows such as Continuous Integration (CI) and Delivery (CD).
When running our unit tests, we will have available additional menu options to run our tests under dotMemory Unit.

Examples of how to use dotMemory Unit
Let’s look at several different ways we can use dotMemory Unit in the unit testing we perform in our .NET and .NET Core solutions. We will start with something simple and get more advanced. As a note, I will be using xUnit framework for my unit testing examples.
Note: when using xUnit, dotMemory Unit’s output will not be visible by default. In order to make it visible, we’ll have to instruct it to use xUnit’s output helper in the unit test class’ constructor:
Checking for Objects
One of the most useful cases we can test for is finding a leak by checking memory for objects of a specific type. We use this type of test to identify performance issues caused by memory traffic in our applications.
In the example above, we are passing a lambda to the Check() method. This will only be done if we run the test using Run Unit Tests under dotMemory Test. The memory object passed to the lambda contains all memory data for the current execution point. The GetObjects() method will return a set of Album objects passed in the second lambda. Finally, the Assert() will check to verify that only a single Album object was passed in the memory object.
Checking Memory Traffic
The test for checking memory traffic is even simpler. All we need to do is mark the test with the <span lang="IT">AssertTraffic</span> attribute. In the example below, we assert that the amount of memory allocated by all the code in DotMemoryTrafficUnitTest() method does not exceed 1,000 bytes.
Comparing Snapshots
We can use checkpoints not only to compare traffic but also for other kinds of snapshot comparisons. In the example below, we assert that no objects from the <span lang="NL">Chinook</span> namespace survived garbage collection in the interval between memoryCheckPoint1 and the second dotMemory.Check() call.
Complex Scenarios for Checking Memory Traffic
If we need to get more complex information about memory traffic, we can use a similar approach to the one from the first example. The lambdas passed to the dotMemory.Check() method verify that the total size of objects implementing the <span lang="PT">Album</span> class created in the interval between memoryCheckPoint1 and memoryCheckPoint2 is less than 1,000 bytes.
Using the Stand-Alone Launcher
What if we cannot use ReSharper and Rider because of where we work or our team’s selected development tools? What if we do want to run tests with a standalone unit test runner (rather than Visual Studio or Rider) or want to make memory tests a part of our continuous integration builds? JetBrains has made those scenarios easy to handle! We can use the standalone dotMemory Unit executable – the dotMemoryUnit.exe command-line tool.
dotMemoryUnit.exe works as a mediator – it runs a standalone unit test runner and provides the support for dotMemory Unit calls in the running tests.
In the simplest case, all we have to do is specify the path to our unit test runner and its arguments. For instance, in the following example we want to run NUnit tests from the MainTests.dll:
dotMemoryUnit.exe "C:\NUnit 3.11.0\bin\nunit-console.exe" -- "E:\MyProject\bin\Release\MainTests.dll"
By default, if the tool finishes its work successfully, its exit code is 0. This is not very convenient when we run the tool on the CI server as we will need to know whether there are any failed tests in the build. In such a case, the best option is to make dotMemoryUnit.exe return the exit code of the unit test runner. To do this, we should use the --propagate-exit-code argument. For example:
dotMemoryUnit.exe "C:\NUnit 3.11.0\bin\nunit-console.exe" --propagate-exit-code
        -- "E:\MyProject\bin\Release\MainTests.dll"
Analyzing Workspaces from dotMemory Unit
The workspaces that are generated and saved by dotMemory Unit can be opened with the stand-alone JetBrains’ app dotMemory. The location where dotMemory Unit saves the *.dmw files by default is our computer’s temp location (%temp%). In some cases, we may want to redefine the workspace files’ location. This is done with the help of DotMemoryUnitAttribute placed before an assembly, a test class, or a test method.
Opening dotMemory in this example will show the details of the two stored snapshots and allow us to see the comparisons and differences.
Wrap-up
dotMemory Unit is very flexible and allows you to check almost any aspect of app memory usage. Use "memory" tests in the same way as unit tests on app logic:
- After we manually find an issue (such as a leak), write a memory test that covers it.
- Write tests for proactive testing – to ensure that new product features do not create any memory issues, like objects left in memory or large traffic.
Thanks for reading and don’t hesitate to try dotMemory Unit on your own! It’s absolutely free, and the only requirement is Rider, ReSharper or dotCover installed on your machine.
Chris Woodruff (or Woody, as he's commonly known) has a degree in Computer Science from Michigan State University’s College of Engineering. Woody has been developing and architecting software solutions for over 20 years and has worked in many different platforms and tools. He’s a community leader, helping such events as GRDevNight, GRDevDay, West Michigan Day of .NET, and Beer City Code. He was also instrumental in bringing the popular Give Camp event to Western Michigan where technology professionals lend their time and development expertise to assist local non-profits. As a speaker and podcaster, Woody has discussed a variety of topics, including database design and open source. He has been a Microsoft MVP in Visual C#, Data Platform, and SQL, and was recognized in 2010 as one of the top 20 MVPs world-wide. Woody is a Developer Advocate for JetBrains and evangelizes .NET, .NET Core, and JetBrains' products in North America.


