|
this is the first one I think I would have ever figured out eventually. These are fun..
To err is human to really elephant it up you need a computer
|
|
|
|
|
Glad you like them!
Feel free to join in - you can win a prize! (Setting it the next weekday.)
"I have no idea what I did, but I'm taking full credit for it." - ThisOldTony
"Common sense is so rare these days, it should be classified as a super power" - Random T-shirt
AntiTwitter: @DalekDave is now a follower!
|
|
|
|
|
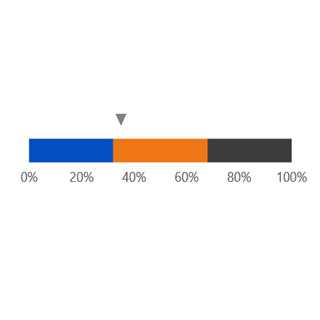
I'm looking for a way to graphically represent an optimum range of values, along with the actual value of a variable. One idea I've seen is a simple bar with a gradient from red to orange, green, back to orange and then to red, with the optimal range being the green zone, and a simple triangle marker pointing to the value of the variable along the range.
I just have no idea what that bar gradient range shower thingy is called, and nor where I'd find one.
Anyone know of such a beast?
Update: Linear Gauge Charts! How did that name escape me? Thank you Wendelius.
cheers
Chris Maunder
modified 3-Jun-21 9:52am.
|
|
|
|
|
A slider with a background? Your background idea seems good! 
Can't be too hard to implement, even as a web control...
This control concept is a nice one! 
|
|
|
|
|
Sounds like a job for CSS gradients. I've used them in simple cases, but I've also seen some very elaborate examples.
Cheers,
Peter
Software rusts. Simon Stephenson, ca 1994. So does this signature. me, 2012
|
|
|
|
|
|
I have such a control, but it will not help you very much. It's actually a +/- control to lower or raise some settings, but the + and - buttons can be hidden away. Colors and other stuff can be set in XAML. The real problem is that it is a control for my own UI which runs in a 3D engine. So, unless you are writing a game...
I have lived with several Zen masters - all of them were cats.
His last invention was an evil Lasagna. It didn't kill anyone, and it actually tasted pretty good.
|
|
|
|
|
I have such UI on my blood test page... You may have too...
[EDIT]
Asked around and they use a product called SCALA - it is payed (and big) so probably not what you need...
"The only place where Success comes before Work is in the dictionary." Vidal Sassoon, 1928 - 2012
modified 3-Jun-21 1:39am.
|
|
|
|
|
|
Yeah - that's pretty close to what I was thinking. I'll follow that lead for some ideas.
cheers
Chris Maunder
|
|
|
|
|
|
Yeah. Linear Gauge Chart.
My sanity is restored. Well, back to normal levels, anyway.
cheers
Chris Maunder
|
|
|
|
|
Show the value as a bar (where the bar length represent the value) and color the bar directly (e.g. red: out, yellow: nearly out, green ok. this of course can be made more smooth). So simply looking to the bar's color tells you ok/nok ...
modified 1-Jul-21 21:01pm.
|
|
|
|
|
Yeah, I know how to do it, I'm just looking for some really slick examples of it. Except my google-fu is just not coming up with any decent examples, so I'm hoping there's an actual name for something like this that will help lead me to the motherlode of ideas.
cheers
Chris Maunder
|
|
|
|
|
google: html meter bar
https://css-tricks.com/css3-progress-bars/
https://css-tricks.com/html5-meter-element/
modified 2-Jul-21 21:01pm.
|
|
|
|
|
Questions pop up:
- What entity or unit does the variable represent?
- is it a numeric value?
- is it something continuous
- are there 'standards' for this type of data
Assuming it is continuous numeric, I would go for a distribution plot _/\_ background
- would make it easy interpretable by the color blind
- it can indicate asymmetric "quality" of the value
- it can have logarithmic scales, or other non linear scales (there might be more optima?)
|
|
|
|
|
- It doesn't matter
- Not necessarily
- Not necessarily
- Irrelevant.
The idea: You have a range of values. Could be dates, or integers, or real numbers, or sorted categories. Doesn't matter. You have an "optimal" range, and you have a pointer pointing to the current value.
It's a super simple concept and I've seen a ton of them (my car's coolant guage to name a random one) but I just don't know what to search for to find really nice examples.
cheers
Chris Maunder
|
|
|
|
|

<html>
<body>
<svg height="150" width="400">
  <defs>
    <linearGradient id="grad1" x1="0%" y1="0%" x2="100%" y2="0%">
            <stop style="stop-color: #fb1b03;stop-opacity: 1" offset="0%"></stop>
            <stop style="stop-color: #f0a208;stop-opacity: 1" offset="14.473684210526185%"></stop>
            <stop style="stop-color: #debb0c;stop-opacity: 1" offset="25.328947368420934%"></stop>
            <stop style="stop-color: #b0cc3d;stop-opacity: 1" offset="34.53947368421038%"></stop>
            <stop style="stop-color: #4bea01;stop-opacity: 1" offset="49.67105263157884%"></stop>
            <stop style="stop-color: #b0cc3d;stop-opacity: 1" offset="61.18421052631564%"></stop>
            <stop style="stop-color: #debb0c;stop-opacity: 1" offset="68.7499999999999%"></stop>
            <stop style="stop-color: #f0a208;stop-opacity: 1" offset="79.27631578947357%"></stop>
            <stop style="stop-color: #f46c06;stop-opacity: 1" offset="88.157894736842%"></stop>
            <stop style="stop-color: #fb1b03;stop-opacity: 1" offset="100%"></stop>
    </linearGradient>
  </defs>
  <rect width="300" height="20" fill="url(#grad1)" />
</svg>
</body>
</html>
|
|
|
|
|
That's a bit simple, isn't it? Where's the 100MB .JS framework you have to load with each page? 
"I have no idea what I did, but I'm taking full credit for it." - ThisOldTony
"Common sense is so rare these days, it should be classified as a super power" - Random T-shirt
AntiTwitter: @DalekDave is now a follower!
|
|
|
|
|
I love me some SVG, shame not more used, I wanted to see what CSS equivalent might look like, so here:
background: linear-gradient(90deg, #fb1b03 0%,
    #f0a208 14.4%,
    #debb0c 25%,
    #b0cc3d 34%,
    #4bea01 49%,
    #b0cc3d 61%,
    #debb0c 68%,
    #f0a208 79%,
    #f46c06 88%,
    #fb1b03 100%
);
|
|
|
|
|
I'm looking for an overly complicated set of examples I can use to maybe research some repos and maybe grab something of npm and then spend a painful weekend wrestling with it and hating the "documentation" (sarcasm added) and you go ahead and just paste the code in less time for me to curse your simplicity and efficiency.
Where is the fun in that, I ask?
cheers
Chris Maunder
|
|
|
|
|
|
Something like:
1_______2___________3_____________4______5
|_______|___________x_____________|______|
where
1 and 5 are the absolute limits?
2 and 4 are the custom limit to be considered for the range?
and 3 the current value?
Being green between 2 and 4,
orange between 1 and 2 or 4 and 5
and red if smaller than 1 or bigger than 5?
M.D.V. 
If something has a solution... Why do we have to worry about?. If it has no solution... For what reason do we have to worry about?
Help me to understand what I'm saying, and I'll explain it better to you
Rating helpful answers is nice, but saying thanks can be even nicer.
|
|
|
|
|
Have you looked at the display widgets used for the status of the core in a nuclear power plant?
|
|
|
|
|
Pretty much exactly what I'm looking for, but if you Google that you don't actually get any UI examples.
I feel like Sam and Dean in Supernatural when their luck was removed and nothing they did seemed to work anymore. My google-fu. Is all gone.
cheers
Chris Maunder
|
|
|
|


 General
  News
News  Suggestion
  Question
  Bug
Bug  Answer
  Joke
Joke  Praise
  Rant
Rant  Admin
Admin 


