This post is the second and final one dedicated to debugging .NET Windows services (you may read the first one here). The inwrap tool (presented in the first part) is not very friendly to use and I myself haven’t used it since then :) It’s not the best advertisement of someone’s own work, but it did motivate me to write another tool which maybe will gain your interest. The winsvcdiag is a simple application that allows you to debug a start of a Windows service from Visual Studio (or any other debugger – even the remote one).
Debugging a Start of a Windows Service
The idea is really simple. I again use the Image File Execution Options to hook upon a service executable. Let’s see how this works for a sample TestService which logic is implemented in a testservice.exe executable. First, we need to create a Debugger value under the key HKLM\SOFTWARE\Microsoft\Windows NT\CurrentVersion\Image File Execution Options\testservice.exe. You may either edit the registry manually or use a shortcut:
winsvcdiag --install testservice.exe
Whichever step you take, the result should look as on the image below (the path to the winsvcdiag may differ).
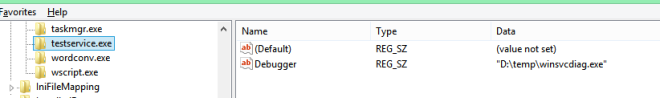
From now, when the service is started by the services.exe process, Windows will first run the winsvcdiag.exe passing to it as a first argument the full path to the service executable. Winsvcdiag starts the process, but in a suspended state (using a special flag CREATE_SUSPENDED – the native part is copied from this CodeProject article):
bool success = NativeMethods.CreateProcess(null, sargs, IntPtr.Zero,
                    IntPtr.Zero, false, ProcessCreationFlags.CREATE_SUSPENDED,
                    IntPtr.Zero, null, ref si, out pi);
and then waits in a loop for a debugger to appear:
while (!isDebuggerPresent) {
...
if (!NativeMethods.CheckRemoteDebuggerPresent(pi.hProcess, ref isDebuggerPresent)) {
failuresCnt++;
continue;
}
Thread.Sleep(1000);
}
As we are not really a debugger, we need to disable the hook while we are calling the CreateProcess function, otherwise winsvcdiag will call itself recursively. Now it’s time for you to set a breakpoint in a service initialization code and attach a debugger to the TestService process (it might run on a remote machine):

In a moment, your breakpoint should be bound and then hit. From now, you may debug the service in the usual way. It is very important that you set the breakpoint before attaching to the service process. Otherwise, you may miss the method you would like to debug. After you are done with diagnosis, uninstall the hook using the –uninstall option – you may always check which hooks are installed with a –list option:
windbgsvc.exe --uninstall testservice.exe
When you debug the start method of a service, you don’t have much time – by default, the start method should finish within 30s and if it fails to do so, it will be killed by the system. As you can imagine 30s usually is not enough to resolve an issue. Fortunately, this timeout is configurable in the registry by the ServicesPipeTimeout value under the key HKLM\SYSTEM\CurrentControlSet\Control. It’s a dword which represents time in milliseconds the services.exe will wait for a service to start (it is called a pipe timeout as the services.exe process communicates with its child services using a pipe). Again, you may modify the registry manually or use the winsvcdiag.exe – the timeout parameter accepts the time in seconds:
PS > .\winsvcdiag.exe --timeout 120
Timeout changed, but reboot is required for the option to take an effect.
A path to the service exe file must be provided.
A reboot is required for this option to take effect.
What About Topshelf Services?
Topshelf is quite restrictive when it comes to its command line parameters. It also checks if its parent process is services.exe and if it is not (which is the case when we start the service from winsvcdiag), it will assume that it is running from the command line. To overcome those restrictions, I prepared the Topshelf.Diagnostics Nuget package. It contains an extension method for an improved parsing of the service command line as well as a changed check for the way the service is run (I assume that it’s not a command line mode if it’s run from a session zero). To apply those changes to your service, you just need to add two lines to the HostConfigurator initialization:
private static void Main() {
    HostFactory.Run(hc => {
        ...
        hc.ApplyCommandLineWithDebuggerSupport();
        hc.UseWindowsHostEnvironmentWithDebugSupport();
        ...
    });
}
The code is available in my dotnet-tools github repo and the binaries can be found here.
Filed under: CodeProject, Diagnosing Applications on Windows


