We all know that we should pro-actively monitor our applications and response is a natural choice when working on performance. Concerning timings, it’s important to keep this golden rule in mind “Average is bad!” Averages are used too often for in monitoring because they are quite easy/memory efficient to compute (sum of values/number of samples). There are hundreds of posts and articles that explain this and why you should not rely on it (like Anscombe’s quartet). Percentiles are much better, but less easy to compute especially on a large-scale distributed system (big data, multiple sources, …)
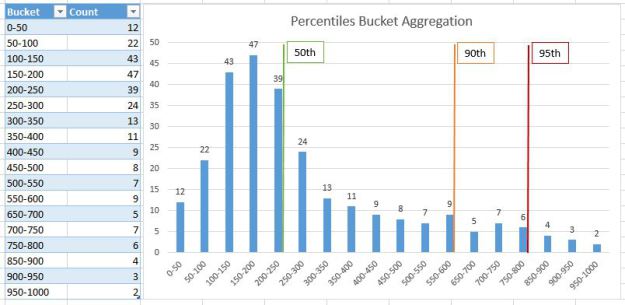
Aggregating percentiles is a common problem for everyone and it exists in a lot of ways to do it. I highly suggest that you read this article from baselab: this is just a must-read if you plan to work on this topic! One section in this last article refers to “Buckets” and this is exactly the approach we will use here. “Another approach is to divide the domain into multiple buckets and for each value/occurrence within the bucket boundaries, increment this bucket’s count by one”.
Increments? Do you know an appropriate key-value store for this purpose? Yes, Redis. My implementation consists of storing all buckets into a redis hash, each bucket being a hash field. The field name is the upper bound and the value is the number of samples for this interval. We use HINCRBY (complexity O(1)) on client/emitter side to increment the number of samples for the target bucket. This will give us some sort of histogram in redis for that event. It could be incremented by one to many clients because commands are isolated and atomic. On the other side (supervisor, admin dashboard, …), in order to get the N-percentile for that hash, we need to get all fields, sort them (hash fields are not sorted by default) and find the exact field name where the aggregated number of samples (starting from the first) is beyond the target number of samples (total samples * N-percentiles).
One particular thing to notice is the bucket size. There is no rule concerning this and it could a constant, linear, exponential, … scale. The choice of the bucket size depends mainly on two factors: the desired accuracy (small size means better accuracy) and the domain (delta between min/max). For example, a constant bucket size of 50 ( [0-50],[50-100],[100-150], …) is not accurate for small values (ex 130 => [100-150]) but much more accurate for higher values (like 1234 => [1200-1250]). Over time, I generally use some kind of varying bucket size inspired by HDR Histogram.
| Bucket Size/Round Factor | Step | Lower Value | Upper Value |
| 1 | 0 | 0 | 128 |
| 2 | 1 | 128 | 384 |
| 4 | 2 | 384 | 896 |
| 8 | 3 | 896 | 1920 |
| 16 | 4 | 1920 | 3968 |
| 32 | 5 | 3968 | 8064 |
| 64 | 6 | 8064 | 16256 |
| 128 | 7 | 16256 | 32640 |
| 256 | 8 | 32640 | 65408 |
Number of Redis Hash Fields
For example, a sample value of 2040 is located in the interval [2032-2048]. This is just an example of a non-linear scale that provides a good accuracy, while keeping an acceptable number of hash fields.
The number of hash fields is important because it will directly impact on memory or storage (if configured). Hashes have a hidden memory optimization using ziplist when the number of fields is below a configurable threshold (512 by default). So, we can’t have too many fields/buckets if persistence is required. In practice, depending on the number of samples and the distribution of values, some buckets are often missing. This is not a problem and give us more possibilities to select the bucket size.
Querying Redis
During my work on this topic, my initial intention was to create a LUA script to compute percentiles in redis: we don’t need to get all the fields+values on the processing side, and percentile computation is just a matter of sorting/counting hash fields. After several tests, I can easily say that it is a very bad idea! The best version of my script is quite efficient – I suppose - but taking several ms for the worst cases (e.g., thousands of buckets). You should know that only one script can be executed at the same time on redis and I prefer to do more IO than blocking my redis instance. By the way, the complexity of HGETALL is O(1), so quite CPU-efficient.
Precision on Client Side
This implementation has a nice advantage: the precision is configured on client/emitter side, because the algorithm to compute the bucket is located there. You could change the algorithm at runtime or even have multiple implementations that you can apply to your components. On server-side, it doesn’t matter because you just have to sort and count. This is pretty good when you have multiple kind of apps and components, all having a unique domain (nano seconds, milliseconds…)
Smart Key Pattern
Since now, I’ve considered only one hash, but this is not enough if we want to create beautiful graphs (99th percentile for the last 7 days per hour). A common way –in NoSQL- to solve this problem is to use the smart key pattern. A Key can be much more that a simple constant string value. If we know how we will query the data model later (and we know in this case), let’s add dynamic parts into the key. We’re working with timeseries so a rounded timestamp is a natural choice. All the keys will follow the pattern ‘mykey:hour:roundedts’.
We can’t aggregate percentiles, and there is no “magical algorithm” to compute percentiles from percentiles. If we want to investigate response times during a few minutes, we need aggregations for every minute. The best way to do this is to increment several smart keys at the same time (minute, 5 minute, hour, day, …) on client side. That’s not a real problem on client side if your binding implements pipelining.
Limit the Impact on Client Side
We’ve seen that buckets can be incremented quite easily on client side, I mean without spending too much CPU cycles. However, it is not always a good thing. Depending on your applications, a better approach could be to implement some kind of batch processing. If you receive 100 requests during the same second, there is a high probability that you could group your timings (10 requests < 10ms, 30 requests between 10 and 20, 15 between 20 and 30ms, …). This will reduce significantly the number of commands executed.
To illustrate the concept, I’ve created a small gist using nodejs. This example is not prod-ready and far from my current implementation (C#) but it should help you to understand the principles of this approach.
A few lines of codes later, and with the help of your favorite chart library, you can visualize this kind of graph. Please take a moment to compare the average and percentiles. Percentiles are definitively much better !

CodeProject


