Sample HTML Report
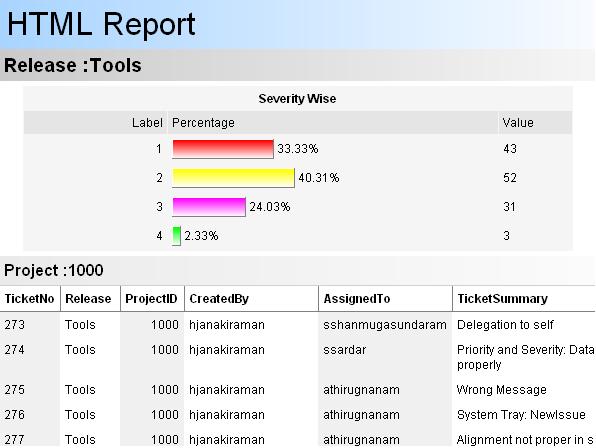
HTML Report Generator - Sample Application Screenshot

Introduction
The HTML Report Engine is a .NET class library which helps in generating well formatted HTML reports. It can take any DataSet as its report source. Reports can have sectional data contents and bar charts.
Background
Crystal Reports is a reporting tool that comes along with VS.NET, but designing and deploying a Crystal Reports report in your application is a bit complex. Though this HTML report engine utility has only limited number of features, it can produce awesome reports with no complex designing and coding work involved.
Using the code
It’s a generic reporting utility which takes as a report source, a DataSet containing at least one DataTable. The class library contains three main classes:
The Field class contains report field information like report column name, column header, background color, and so on.
The Section class holds information about a section like ‘group by’ column name, title prefix, background color, charting information, and so on.
The Report class contains all the methods and properties required to render an HTML report. In this class, a few CSS (Cascaded Style Sheet) classes are used to format the report content. The following code sample explains how to use this utility in your application:
using HTMLReportEngine;
Report report = new Report();
report.ReportTitle = "Issue Report";
report.ReportSource = ds;
Section release = new Section("Release","Release: ");
Section project = new Section("Project","ProjectID: ");
release.SubSection = project;
report.Sections.Add(release);
report.ReportFields.Add(new Field("TicketNo", "Ticket", 50, ALIGN.RIGHT));
report.ReportFields.Add(new Field("CreatedBy", "CreatedBy", 150));
report.ReportFields.Add(new Field("AssignedTo", "AssignedTo"));
report.ReportFields.Add(new Field("Release", "Release", 200));
report.ReportFields.Add(new Field("Project", "Project", 150, ALIGN.RIGHT));
report.SaveReport(@"C:\Data\Report.htm");
Class properties and methods
| Field |
| Property | Type | Description |
FieldName | String | A column name in the DataSet. |
HeaderName | String | String to be displayed as column header. |
Width | Int | Width of the column in pixels. |
Alignment | ALIGN | Text alignment of the field. Default is ALIGN.LEFT. |
BackColor | Color | Column background color. |
HeaderBackColor | Color | Column header background color. |
isTotalField | bool | If true, the field is included for total. Default is false. |
Field() | Constructor | There are eight overloaded constructors available. |
| Section |
| Property | Type | Description |
GroupBy | String | Column name on which group by is to be applied. |
TitlePrefix | String | Prefix text for section header. |
BackColor | Color | Section header background color. |
GradientBackground | bool | true – to display gradient color; false – to display plain background color. Default is false. |
IncludeTotal | bool | Display/hide Total row. |
SubSection | Section | Subsection of type Section. |
IncludeChart | bool | Display/hide chart. |
ChartTitle | String | Chart title text. |
ChartShowAtBottom | bool | true - show chart at bottom (after data rows); false – show chart at top. Default is false. |
ChartChangeOnField | String | Chart Y-axis field, usually text field. |
ChartValueField | String | Chart X-axis field, must be a numeric field. Default is record count. |
ChartShowBorder | bool | Enable/disable chart border. |
ChartLabelHeader | String | Chart label column header text. Default is ‘Label’. |
ChartPercentageHeader | String | Chart percentage column header text. Default is ‘Percentage’. |
ChartValueHeader | String | Chart value column header text. Default is ‘Value’. |
Section() | Constructor | There are three overloaded constructors available. |
| Report |
| Property | Type | Description |
ReportTitle | String | Report title text. |
ReportSource | DataSet | Report source is a DataSet. The DataSet must contain at least one DataTable with data. |
Sections | ArrayList | Collection of report sections. Each element is of type Section. |
ReportFields | ArrayList | Collection of report fields. Each element is of type Field. |
ReportFont | String | Report font as string. |
TotalFields | ArrayList | Collection of column names to be listed in Total row. Each element is of type string. |
IncludeTotal | bool | Display/hide Total row. |
IncludeChart | bool | Display/hide chart. |
ChartTitle | String | Chart title text. |
ChartShowAtBottom | bool | true - show chart at bottom (after data rows); false – show chart at top. Default is false. |
ChartChangeOnField | String | Chart Y-axis field, usually text field. |
ChartValueField | String | Chart X-axis field, must be a numeric field. Default is record count. |
ChartShowBorder | bool | Enable/disable chart border. |
ChartLabelHeader | String | Chart label column header text. Default is ‘Label’. |
ChartPercentageHeader | String | Chart percentage column header text. Default is ‘Percentage’. |
ChartValueHeader | String | Chart value column header text. Default is ‘Value’. |
GenerateReport() | Method | Generates the HTML report and returns it as a StringBuilder object. |
SaveReport(string fileName) | Method | Generates the HTML report and saves it to disk with the given file name. |
Formatting the report
Including totals
This report engine supports multiple SUM fields for a report. And the SUM can be displayed on demand in any of the sections added to the report. The SUM field must be of type numeric. The following code explains how to add SUM fields:
report.TotalFields.Add("Project");
report.TotalFields.Add("ProgressedHours");
project.IncludeTotal = true;
release.IncludeTotal = true;
Adding charts
This engine can produce bar charts. The developer has to provide only the ChangeOnField and ValueField as input. If the developer has not given any ValueField, the record count will be taken as the Value. Changing the ChartShowAtBottom property would let your charts come either at the top or the bottom of the section.
release.ChartChangeOnField = "Severity";
release.ChartValueField = "ProgressedHours";
release.ChartTitle = "Severity-Wise report";
release.ChartLabelHeader = "Severity Type";
release.ChartValueHeader = "Hours";
release.ChartPercentageHeader = "Progress";
Aligning fields
Field texts can be aligned to Left, Right, or Center. By default, the text alignment is set to Left.
Field field1 = new Field();
field1.Alignment = ALIGN.RIGHT;
Specifying colors
The developers are allowed to change the background colors of section headers, column headers, and column data. Section headers can have gradient backgrounds by setting the GradientBackground property to true.
release.BackColor = Color.WhiteSmoke;
release.GradientBackground = true;
project.BackColor = Color.GhostWhite;
project.GradientBackground = true;
field1.HeaderBackColor = Color.LightSlateGray;
field1.BackColor = Color.Gainsboro;
field2.HeaderBackColor = Color.LightSlateGray;
field2.BackColor = Color.White;
field3.HeaderBackColor = Color.LightSlateGray;
field3.BackColor = Color.Gainsboro;
Points of interest
It is recommended that you specify the column width for all report fields except one. That one may be a variable text field. The field without column width will automatically fit into the remaining space available in the table.
There is a simple way to export data to MS Excel. You can open the generated HTML file in Internet Explorer, right click on the report, and select 'Export to Excel'. Done!
History
- Version 2.0 - Added features for formatting and to allow multiple Total columns in the report.
- Version 1.0 - Initial version.
Ambalavanar, working as a .NET Solutions Architect at BNY Mellon (iNautix), Chennai. Enjoys designing and developing UI & highly scalable apps.


 General
  News
News  Suggestion
  Question
  Bug
Bug  Answer
  Joke
Joke  Praise
  Rant
Rant  Admin
Admin 


![Rose | [Rose]](https://codeproject.freetls.fastly.net/script/Forums/Images/rose.gif)


![Rose | [Rose]](https://codeproject.global.ssl.fastly.net/script/Forums/Images/rose.gif)