Introduction
Crystal report is a report design tool which allows creating reports capable of retrieving and formatting a result set from a database or other datasource. In addition to simply reading data from a data source, <city w:st="on"><place w:st="on">Crystal report has its own formula languages for creating calculations and includes a number of features that can be used to turn raw data into presentation-quality reports, with graphs, charts, running totals and so on. This article explains how crystal reports are using in C# Windows based application. Visual Studio 2003 .NET contains a bundled version of <city w:st="on"><place w:st="on">Crystal report version 9 and we can use the reports inside the developing environment.
Overview
Report Objects
The Crystal Report Designer uses a drag-and-drop approach similar to Visual Studio .NET — you drag a report object onto the Designer (such as a database field or text object) and use the Property Window or shortcut menu to format the object.
Some report objects that you can add to your report and format according to your needs include:
- Database fields
- Formula fields
- Parameter fields
- Group Name fields
- Running Total fields
- Summary fields
- Charts
- Subreports
Report Sections
The Crystal Report Designer is divided into report sections, such as section headers, footers, and details. You drag objects onto a report section.
The data that appears in the finished report is contingent upon your design choices. In particular, report data varies depending on the sections into which you choose to insert particular report objects. For example, if you insert a chart object in the Report Header section, the chart will appear only once at the beginning of the report and will summarize the data contained in the report. Alternatively, if a chart object is added to the Group Header section, a separate chart will appear at the beginning of each group of data and will summarize the data relating only to that group.
Report Header
Objects placed in the Report Header section print once, at the beginning of the report.
The Report Header section generally contains the report title and other information you want to appear only at the beginning of the report. Charts and cross-tabs placed in this section contain data for the entire report. Formulas placed in this section are evaluated once, at the beginning of the report.
Page Header
Objects placed in the Page Header section print at the beginning of each new page.
The Page Header section generally contains information that you want to appear at the top of each page. This can include text fields such as chapter names, document name, or other similar information. This section can also be used to contain field titles, which will then display as labels above the columns of field data in the report. Charts or cross-tabs cannot be placed in this section. Formulas placed in this section are evaluated once per page, at the beginning of each new page.
Details
Objects placed in the Details section print with each new record.
The Details section contains data for the body of the report. The bulk of the report data usually appears in this section. When the report is run, the Details section is re-printed for each record. For example, if you add a database object to the Details section, and this database object contains 100 records, then the report will print 100 individual detail sections at runtime. Charts or cross-tabs cannot be placed in this section. Formulas placed in this section are evaluated once for each record.
Report Footer
Objects placed in the Report Footer section print once at the end of the report.
This section is used to contain information you want to appear only once at the end of the report, such as grand totals. Charts and cross-tabs placed in this section contain data for the entire report. Formulas placed in this section are evaluated once, at the end of the report.
Page Footer
Objects placed in the Page Footer section print at the bottom of each page.
This section usually contains the page number and any other information you want to appear at the bottom of each page. Charts and cross-tabs cannot be placed in this section. Formulas placed in this section are evaluated once per page, at the end of each new page.
Additional Report Sections
If a group, summary, or subtotal is added to the report, the program creates two additional sections: the Group Header and the Group Footer.
When a group, summary, or subtotal is added, the Group Header section appears directly above the Details section, and the Group Footer section appears directly below the Details section. Like the original report sections, each of these newly added sections could contain one or more subsections. By default, they each contain a single section.
Group header
Objects placed in the Group Header section print at the beginning of each new group.
This section typically holds the group name field, and it can also be used to display charts or cross-tabs that include data specific to the group. The Group Header section is printed once at the beginning of each group. Charts and cross-tabs placed in this section contain data just for the group. Formulas placed in this section are evaluated once for each group, at the beginning of the group.
Group Footer
Objects placed in the Group Footer section print at the end of each group.
This section generally holds the summary value, if any, and can be used to display charts or cross-tabs. The Group Footer section is printed once at the end of each group. Charts and cross-tabs placed in this section contain data just for the group. Formulas placed in this section are evaluated once for each group, at the end of the group.
Showing Report In the Application
Adding Windows form viewers to Application
The CrystalReportViewer control allows a Crystal Report to be viewed in an application. The CrystalReportViewer allows users to navigate through different pages (go to the first page, last page, next page, previous page and go to a page number) and provides features to print report, export report to a particular format (i.e. .pdf, .doc, .xls and .rtf formats). It also provides the report to view in different zoom levels.
Steps to add a CrystalReportViewer in a form are as follows:
- Open the
Toolbox and drag a CrystalReportViewer onto your form - Resize and move the Windows Forms Viewer as desired by dragging and dropping
- When you run your application, the report is displayed in the viewer.
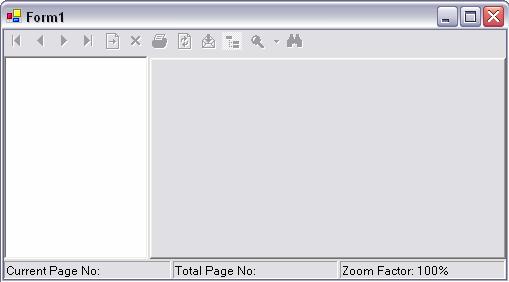
Image shows a crystal report viewer inside a form in a Windows based application
Adding Reports in the application
For adding crystal reports to our application, right click the project and select add-> add new item menu. The following dialog box will come. We can select the crystal report from the stated dialog.

The <city w:st="on"><place w:st="on">Crystal report is a file with .rpt extension. While adding the report, the developing environment automatically binds it with a class file with the same name of the report. The class file contains the resource name i.e. the .rpt file, all the sections inside the .rpt file and some other information. This .cs file is used for the interface between the report and the application.
Setting data to Crystal Report
Adding .xsd file to project
The XML Designer in VS 2003 developing environment supports the XML Schema Definition (XSD) language defined by the World Wide Web Consortium (WC3). Schema view provides a visual representation of the elements, attributes, types, and so on that make up XML Schemas and ADO.NET datasets. For adding an XSD file, right click on the project and select Add-> Add new item and select the Data Set as shown below.
While adding an XSD file, the developing environment automatically binds it with a class file (.cs) and .xsx file. The class file contains runtime classes of XSD schema file. The generated classes can be used in conjunction with System.XML.Serialization.XMLSerializer to read and write XML code that follows the schema. The .xsx file holds the layout information for components on the designer surface.
Creating data tables
Open the xsd file and from the toolbox, click element object and drag to the work area. This operation will add a table to the dataset. We can design the table according to our requirements and it provides almost all the data types for a table design. We can add any number of tables into one dataset.
Map the tables with Crystal Report
Double click the crystal report to view the crystal report designer. Select the field explorer window, right click the Database fields and select Add/Remove Database sub menu as shown below. If the field explorer window is not present then select View->Other windows -> Document outline or press Ctrl+Alt+T to see the same.
From the next Window expand the project data node. (The project Data contains all the project datasets (datasets contained in the .xsd files)). From there, we can select the previously added dataset (CrystalDemo.DatasetDemo) and select the table names that we want to bind with crystal report and click the right arrow and press OK.
If more than one table is selected from the Database Expert dialog, then after clicking OK another dialog will come asking the link between tables.
We can browse the dataset in the report designer.
The next step is to click the required fields from the field explorer and drag to the Crystal Report and place it in the detailed section (Normally the detailed section contains the data).
Binding Reports to Crystal Report Viewer at run time
Now the crystal report is ready to display. We have to supply data for displaying and need to set the report to crystal report viewer. For that, first have to create a DataTable with name table1 and dynamically add columns with the same name of the previous data table (created in the previous section – in xsd file). Give data to the data table. The next step is to create an instance of the <city w:st="on"><place w:st="on">Crystal report and set the allocated data table as the data source. Then assign the report to the crystal report viewer's report source. Run the application. Below sample code gives an idea about displaying a report.
demoTable = new DataTable("table1");
demoTable.Columns.Add("Name");
demoTable.Columns.Add("Age");
demoTable.Columns.Add("Address");
demoTable.Columns.Add("Phone");
for (int index = 1; index <= 1000; index++)
{
Random rnd = new Random();
DataRow row = demoTable.NewRow();
row["Name"] = "Prathap";
row["Age"] = rnd.Next(10,100);
row["Address"] = "Trivandrum";
row["Phone"] = "954712449198";
demoTable.Rows.Add(row);
}
CrystalReportDemo report = new CrystalReportDemo();
report.Database.Tables["table1"].SetDataSource((DataTable)demoTable);
crystalReportViewer.ReportSource = report;
Author Profile
He is working as Software Engineer at Network Systems & Technologies (p) Ltd and is currently associated with NeST Avionics.


 General
  News
News  Suggestion
  Question
  Bug
Bug  Answer
  Joke
Joke  Praise
  Rant
Rant  Admin
Admin 


