Introduction
In our application, we had to display the output of a multichannel ECG (Electro Cardiograph) device. I had a look at some commercial libraries, but none of them met by demands. So, I decided to design a simple solution by myself.
This is my attempt to design a flexible, easy to use library for drawing graphs.
The library is capable of displaying multiple graphs in different layouts. Right now, five modes of display are possible:
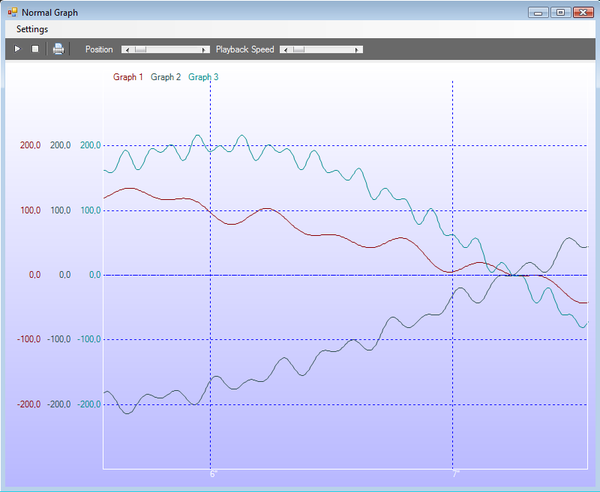
- Normal: means that all data sources are displayed in one graph window, with separate ordinates.
- Stacked: means that all data sources are displayed in one graph window, stacked vertically, with shared ordinate and shared abscissa.
- Vertical aligned: means that the graph windows are displayed vertically aligned, with separate ordinates and shared abscissa.
- Tiled horizontal: means that the data sources are displayed in tiled windows (preferred alignment direction is horizontal).
- Tiled vertically: means that the data sources are displayed in tiled windows (preferred alignment direction is vertical).
Graphs can be displayed unscaled or auto-scaled. In the auto-scale mode, the visible graph is automatically fit to the visible area.
The following images show examples for the different display modes:
Normal:
Stacked:

Tiled horizontal:
Tiled vertical:
Vertical aligned:
Autoscaled X-Axis
The following images show a sample of an ECG application, where eight data sources are displayed vertically tiled and auto-scaled.
Using the Code
The control is very simple to use. Just have a look at the sample application. The following code shows how the part in the demo application where the graphs for the different examples are generated:
protected void CalcDataGraphs()
{

    this.SuspendLayout();

    display.DataSources.Clear();
    display.SetDisplayRangeX(0, 400);

    for (int j = 0; j < NumGraphs; j++)
    {
        display.DataSources.Add(new DataSource());
        display.DataSources[j].Name = "Graph " + (j + 1);
        display.DataSources[j].OnRenderXAxisLabel += RenderXLabel;

        switch (CurExample)
        {
            case  "NORMAL":
                this.Text = "Normal Graph";
                display.DataSources[j].Length = 5800;
                display.PanelLayout = PlotterGraphPaneEx.LayoutMode.NORMAL;
                display.DataSources[j].AutoScaleY = false;
                display.DataSources[j].SetDisplayRangeY(-300, 300);
                display.DataSources[j].SetGridDistanceY(100);
                display.DataSources[j].OnRenderYAxisLabel = RenderYLabel;
                CalcSinusFunction_0(display.DataSources[j], j);
                break;

            case "NORMAL_AUTO":
                this.Text = "Normal Graph Autoscaled";
                display.DataSources[j].Length = 5800;
                display.PanelLayout = PlotterGraphPaneEx.LayoutMode.NORMAL;
                display.DataSources[j].AutoScaleY = true;
                display.DataSources[j].SetDisplayRangeY(-300, 300);
                display.DataSources[j].SetGridDistanceY(100);
                display.DataSources[j].OnRenderYAxisLabel = RenderYLabel;
                CalcSinusFunction_0(display.DataSources[j], j);
                break;

            case "STACKED":
                this.Text = "Stacked Graph";
                display.PanelLayout = PlotterGraphPaneEx.LayoutMode.STACKED;
                display.DataSources[j].Length = 5800;
                display.DataSources[j].AutoScaleY = false;
                display.DataSources[j].SetDisplayRangeY(-250, 250);
                display.DataSources[j].SetGridDistanceY(100);
                CalcSinusFunction_1(display.DataSources[j], j);
                break;

            case "VERTICAL_ALIGNED":
                this.Text = "Vertical aligned Graph";
                display.PanelLayout =
                    PlotterGraphPaneEx.LayoutMode.VERTICAL_ARRANGED;
                display.DataSources[j].Length = 5800;
                display.DataSources[j].AutoScaleY = false;
                display.DataSources[j].SetDisplayRangeY(-300, 300);
                display.DataSources[j].SetGridDistanceY(100);
                CalcSinusFunction_2(display.DataSources[j], j);
                break;

            case "VERTICAL_ALIGNED_AUTO":
                this.Text = "Vertical aligned Graph autoscaled";
                display.PanelLayout =
                    PlotterGraphPaneEx.LayoutMode.VERTICAL_ARRANGED;
                display.DataSources[j].Length = 5800;
                display.DataSources[j].AutoScaleY = true;
                display.DataSources[j].SetDisplayRangeY(-300, 300);
                display.DataSources[j].SetGridDistanceY(100);
                CalcSinusFunction_2(display.DataSources[j], j);
                break;

            case "TILED_VERTICAL":
                this.Text = "Tiled Graphs (vertical prefered)";
                display.PanelLayout = PlotterGraphPaneEx.LayoutMode.TILES_VER;
                display.DataSources[j].Length = 5800;
                display.DataSources[j].AutoScaleY = false;
                display.DataSources[j].SetDisplayRangeY(-300, 600);
                display.DataSources[j].SetGridDistanceY(100);
                CalcSinusFunction_2(display.DataSources[j], j);
                break;

            case "TILED_VERTICAL_AUTO":
                this.Text = "Tiled Graphs (vertical prefered) autoscaled";
                display.PanelLayout = PlotterGraphPaneEx.LayoutMode.TILES_VER;
                display.DataSources[j].Length = 5800;
                display.DataSources[j].AutoScaleY = true;
                display.DataSources[j].SetDisplayRangeY(-300, 600);
                display.DataSources[j].SetGridDistanceY(100);
                CalcSinusFunction_2(display.DataSources[j], j);
                break;

            case "TILED_HORIZONTAL":
                this.Text = "Tiled Graphs (horizontal prefered)";
                display.PanelLayout = PlotterGraphPaneEx.LayoutMode.TILES_HOR;
                display.DataSources[j].Length = 5800;
                display.DataSources[j].AutoScaleY = false;
                display.DataSources[j].SetDisplayRangeY(-300, 600);
                display.DataSources[j].SetGridDistanceY(100);
                CalcSinusFunction_2(display.DataSources[j], j);
                break;

            case "TILED_HORIZONTAL_AUTO":
                this.Text = "Tiled Graphs (horizontal prefered) autoscaled";
                display.PanelLayout = PlotterGraphPaneEx.LayoutMode.TILES_HOR;
                display.DataSources[j].Length = 5800;
                display.DataSources[j].AutoScaleY = true;
                display.DataSources[j].SetDisplayRangeY(-300, 600);
                display.DataSources[j].SetGridDistanceY(100);
                CalcSinusFunction_2(display.DataSources[j], j);
                break;

            case "ANIMATED_AUTO":

                this.Text = "Animated graphs fixed x range";
                display.PanelLayout = PlotterGraphPaneEx.LayoutMode.TILES_HOR;
                display.DataSources[j].Length = 402;
                display.DataSources[j].AutoScaleY = false;
                display.DataSources[j].AutoScaleX = true;
                display.DataSources[j].SetDisplayRangeY(-300, 500);
                display.DataSources[j].SetGridDistanceY(100);
                display.DataSources[j].XAutoScaleOffset = 50;
                CalcSinusFunction_3(display.DataSources[j], j, 0);
                display.DataSources[j].OnRenderYAxisLabel = RenderYLabel;
                break;
        }
    }

    ApplyColorSchema();

    this.ResumeLayout();
    display.Refresh();

}
The functions CalcSinusFunction_0 CalcSinusFunction_1 and CalcSinusFunction_2 are used to calculate the different sinus functions for the graphs:
protected void CalcSinusFunction_0(DataSource src, int idx)
{
    for (int i = 0; i  < src.Length; i++)
    {
        src.Samples[i].x = i;
        src.Samples[i].y = (float)(((float)200 * Math.Sin((idx + 1) *(
            i + 1.0) * 48 / src.Length)));
    }
}
The functions RenderYLabel and RenderXLabel are used to render the X and Y legends of the graph.
private String RenderXLabel(DataSource s, int idx)
{
    if (s.AutoScaleX)
    {
        int Value = (int)(s.Samples[idx].x );
        return "" + Value;
    }
    else
    {
        int Value = (int)(s.Samples[idx].x / 200);
        String Label = "" + Value + "\"";
        return Label;
    }
}

private String RenderYLabel(DataSource s, float value)
{
    return String.Format("{0:0.0}", value);
}
Summary
There are lots of parameters that can be twisted which are not explained here - just look at the code. This library is far from being finished, but it is a good point to start from. The code is simple and self-explaining. From here, it will be simple to adopt the code for your needs.
I got so much inputs from here, and I wanted to give something back. So, here is my first article on The Code Project. I hope you like it.
To Do
Version History
- 04.09.2014 - First update in 4 years. Found back into my code ;-) Upgraded solution to VS 2013 Express. Cleaned up some magic numbers. More to follow soon ;-)
- 12.07.2009 - Updated article.
- 12.02.2009 - Implemented x autoscaling.
- 28.01.2009 - Some more cleanups. Implemented Print Form.
- 27.01.2009 - New display mode, some cleanups.
- 25.01.2009 - Initial release.
I have started programming at the age of 13 on the commodore 64.
Ever since then I have been programming on many systems in many languages.
During the last 12 years I have been working as professional programmer in different companies and different areas.
Now I am working as freelancer programmer / consultant


 General
  News
News  Suggestion
  Question
  Bug
Bug  Answer
  Joke
Joke  Praise
  Rant
Rant  Admin
Admin 


 I'm working on a project - an application for aquisition and saving data (for example from ECG) and now also displaing the data.


