14 Sep 2013 by All Time Programming
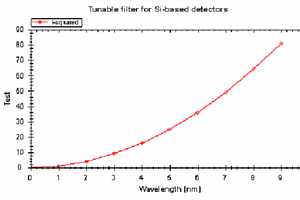
Hi, I have a collection of LineSeries with List> in my chart. I have set the Min & Max values for X & Y axis. In my Y Axis, I want numbers to be of Log(10) scale. For eg:, if I have data ranging Y from 0, 1000, then on Y Axis I should see only 0, 10, 100 & 1000. My XML...