Introduction
This is an add-on for the Microsoft Web Chart control. It is a new series type that draws a Bezier curve according to the points you pass.
Using the code
I recently needed a Bezier graph in a web app. The Microsoft Web Chart control (which is actually the Dundas chart control) is a powerful control, so I added the functionality I needed to it. For the calculation of the Bezier curve itself, I used code from a CodeProject article by Tolga Birdal, you can find his work here. I encapsulated his code in a class called CalcBezierCurve. Then I created a new class BezierSeries which inherits from System.Web.UI.DataVisualization.Charting.Series. So you can use it in any chart from the Web Chart control.
public class BezierSeries : Series
{
#region fields
private int _pointsOnCurve = 1000;
private List<DataPoint> _bezierPoints = new List<DataPoint>();
#endregion
#region properties
public int PointsOnCurve
{
get { return _pointsOnCurve; }
set
{
if (value < 2)
{
value = 2;
}
if (value % 2 == 1)
{
value++;
}
_pointsOnCurve = value;
}
}
public List<DataPoint> BezierPoints
{
get
{
return _bezierPoints;
}
set
{
if (value != null)
{
_bezierPoints = value;
List<double> ptList = new List<double>();
foreach (DataPoint point in value)
{
ptList.Add(point.XValue);
ptList.Add(point.YValues[0]);
}
CalcBezierCurve bc = new CalcBezierCurve();
double[] ptind = new double[ptList.Count];
double[] p = new double[PointsOnCurve];
ptList.CopyTo(ptind, 0);
bc.Bezier2D(ptind, (PointsOnCurve) / 2, p);
this.ChartType = SeriesChartType.Line;
for (int i = 0; i < p.Count(); i = i + 2)
{
this.Points.AddXY(p[i], p[i + 1]);
}
}
}
}
#endregion
}
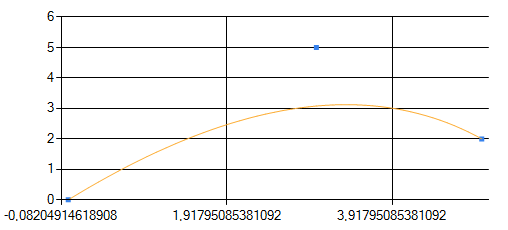
The usage is quite simple (I assume you have a web form with a chart control called Chart1 on it):
protected void Page_Load(object sender, EventArgs e)
{
List<DataPoint> bezierPoints = new List<DataPoint>();
bezierPoints.Add(new DataPoint(0, 0));
bezierPoints.Add(new DataPoint(3, 5));
bezierPoints.Add(new DataPoint(5, 2));
Chart1.Series.Clear();
Chart1.ChartAreas.Clear();
ChartArea bezierPointsArea = new ChartArea("BezierPointsArea");
Chart1.ChartAreas.Add(bezierPointsArea);
Series bezierPointSeries = new Series("BezierPoints");
bezierPointSeries.ChartType = SeriesChartType.Point;
foreach (DataPoint bezierPoint in bezierPoints)
{
bezierPointSeries.Points.Add(bezierPoint);
}
Chart1.Series.Add(bezierPointSeries);
ChartArea bezierCurveArea = new ChartArea("BezierCurveArea");
Chart1.ChartAreas.Add(bezierCurveArea);
BezierSeries bezierSeries = new BezierSeries();
bezierSeries.Name = "BezierCurve";
bezierSeries.PointsOnCurve = 100;
bezierSeries.BezierPoints = bezierPoints;
Chart1.Series.Add(bezierSeries);
}
And this is the result:
History
- 2011-03-17 V 1.0: Initial version.
Born and living in Vienna, Austria. Started with Pascal in 1993 and MS-DOS 5.0. After that a little C++ in OS/2 and loads of VBA with Access in Windows 95,98, NT. To get more professionel I started C# in 2002 and did some MCP exams on that. After working for my own company I got hired by different companies. Currently I'm employed at the Federal Chambers of Commerce as a Senior Software Engineer.


 General
  News
News  Suggestion
  Question
  Bug
Bug  Answer
  Joke
Joke  Praise
  Rant
Rant  Admin
Admin 


 . So I guess you set the