Introduction
This article is Part 3 of Windows Debugging Techniques. This article is concentrated on how to automate the dump generation process in the application itself.
Note:This is series of articles divided into 5 parts
Part 1: Windows Debugging Techniques - Debugging Application Crash (Windbg)
Part 2: Windows Debugging Techniques - Debugging Application Crash (DebugDiag, AppVerifier)
Part 3: Windows Debugging Techniques - Debugging Application Crash (Self Dump Generation)
Part 4: Windows Debugging Techniques - Debugging Memory Leaks (Perfmon)
Part 5: Windows Debugging Techniques - Debugging Memory Leaks (CRT APIs)
Background
As you have noticed in the first two parts we were generating dumps when required,
which means we need to reproduce the problem and also we need to put procdump on the target machine to get the dump.
On a production system customers will very often not agree to installation of any applications on the system.
The other side of the coin is we might not get the issue again, it might be an intermittent, which would still be production
but the customer is not able to give the exact steps to reproduce the problem. This could be a really problematic situation for the product management.
It would be really great if when the application crashes it generates its crash dump on its own which could be collected later for analysis.
Definition
A dump file is a snapshot of an app at the point in time the dump is taken. It shows what process was executing and what modules were loaded. Dumps are primarily used for debugging issues that occur on machines that the developer doesn’t have access to. For example, you can use a dump file from a customer's machine when you can’t reproduce the customer's crash or hang on your machine.
There are 2 kinds of Dumps
1. Mini Dump : Stores only a Subset of Process Information, Typically some information related to Threads Stack, Process Environment etc. A Mini Dump is smaller in size typically 1.5 MB or even less.
2. Full Dump : Stores all information concerning the virtual memory of the process, like Threads, Call Stack, heap state, Library Loaded. Basically every information related to a process is available. Full Dump is as big as process's virtual memory Typically some hundreds of MB's or even GB's.
To Analyze what is going wrong in our process it is better to have a Full Dump, MiniDump could also be helpful in some cases.
Let's understand step by step how can we do a Self Dump Generation.
The Source Code
The exception is an unexpected situation, that, when encountered, leads to the application exiting.
So we should keep a tabs on this exception. How do we do that? On Windows Platform there is an API.
LPTOP_LEVEL_EXCEPTION_FILTER WINAPI SetUnhandledExceptionFilter(
  _In_  LPTOP_LEVEL_EXCEPTION_FILTER lpTopLevelExceptionFilter
);
This API would be called for any unhandled exception in any thread inside a given process. This API should be called in the first entry point of the application [normally in unmanaged code it is main()]. This API expects a parameter that is an exception handler, which defines what should be done when this situation arrives. So now code would look something like this:
int main()
{
 SetUnhandledExceptionFilter( unhandled_handler);
}

LONG CALLBACK unhandled_handler(EXCEPTION_POINTERS* e)
{
    return EXCEPTION_CONTINUE_SEARCH;
}
Now we need to decide what should be done inside the
unhandled_handler, in our case create the dump
int main()
{
 SetUnhandledExceptionFilter( unhandled_handler);
}

LONG CALLBACK unhandled_handler(EXCEPTION_POINTERS* e)
{
	make_minidump(e);
    return EXCEPTION_CONTINUE_SEARCH;
}

void make_minidump(EXCEPTION_POINTERS* e)
{
	TCHAR tszFileName[MAX_BUFF_SIZE] = {0};
	TCHAR tszPath[MAX_BUFF_SIZE] = {0};
	SYSTEMTIME stTime = {0};
	GetSystemTime(&stTime);
	SHGetSpecialFolderPath(NULL,tszPath, CSIDL_APPDATA, FALSE);
	StringCbPrintf(tszFileName,
			       _countof(tszFileName),
				   _T("%s\\%s__%4d%02d%02d_%02d%02d%02d.dmp"),
				   tszPath, _T("CrashDump"),
				   stTime.wYear,
				   stTime.wMonth,
				   stTime.wDay,
				   stTime.wHour,
				   stTime.wMinute,
				   stTime.wSecond);

    HANDLE hFile = CreateFile(tszFileName, GENERIC_WRITE, FILE_SHARE_READ, 0, CREATE_ALWAYS, FILE_ATTRIBUTE_NORMAL, 0);
    if(hFile == INVALID_HANDLE_VALUE)
        return;

    MINIDUMP_EXCEPTION_INFORMATION exceptionInfo;
    exceptionInfo.ThreadId = GetCurrentThreadId();
    exceptionInfo.ExceptionPointers = e;
    exceptionInfo.ClientPointers = FALSE;

    MiniDumpWriteDump(
        GetCurrentProcess(),
        GetCurrentProcessId(),
        hFile,
        MINIDUMP_TYPE(MiniDumpWithIndirectlyReferencedMemory | MiniDumpScanMemory | MiniDumpWithFullMemory),
        e ? &exceptionInfo : NULL,
        NULL,
        NULL);

	if(hFile)
	{
		CloseHandle(hFile);
		hFile = NULL;
	}
    return;
}
So now inside the function unhandled_handler we are calling make_minidump, which actually writes the dump.
The function unhandled_handler is a callback function which receives the EXCEPTION_POINTERS.
This structure contains the exception information based on the machine generating it.
EXCEPTION_POINTERS is being passed to function make_minidump, which actually writes the dump to the disk.
The first portion of the function make_minidump is just creating the name of the file based on the application name and the timestamp.
Then the file is being created using "CreateFile".
"MINIDUMP_EXCEPTION_INFORMATION" structure is being filled with CurrentThreadID and Exception pointers which we received from the parent function. Then call the function MiniDumpWriteDump. The interesting parameter here is MINIDUMP_TYPE. If we see msdn help on this API there is quite a big list, but based on my analysis I have added three flags, out of these the third is the most important is MiniDumpWithFullMemory. This gives all the referenced locations of the particular process in the main memory, which really helps in debugging.
With a full memory dump the size of the dump is quite big, but this really helps in analyzing the dump.
With similar flows you can explore more on types of dumps and change it according to your requirements.
Let's take an example and see how this works.
#include <Windows.h>
#include <Dbghelp.h>
#include <iostream>
#include <tchar.h>
#include <strsafe.h>
#include <shlobj.h>

#pragma comment(lib, "DbgHelp")
#define MAX_BUFF_SIZE 1024

using namespace std;
DWORD WINAPI func();

void make_minidump(EXCEPTION_POINTERS* e)
{
	TCHAR tszFileName[MAX_BUFF_SIZE] = {0};
	TCHAR tszPath[MAX_BUFF_SIZE] = {0};
	SYSTEMTIME stTime = {0};
	GetSystemTime(&stTime);
	SHGetSpecialFolderPath(NULL,tszPath, CSIDL_APPDATA, FALSE);
	StringCbPrintf(tszFileName,
			       _countof(tszFileName),
				   _T("%s\\%s__%4d%02d%02d_%02d%02d%02d.dmp"),
				   tszPath, _T("CrashDump"),
				   stTime.wYear,
				   stTime.wMonth,
				   stTime.wDay,
				   stTime.wHour,
				   stTime.wMinute,
				   stTime.wSecond);

    HANDLE hFile = CreateFile(tszFileName, GENERIC_WRITE, FILE_SHARE_READ, 0, CREATE_ALWAYS, FILE_ATTRIBUTE_NORMAL, 0);
    if(hFile == INVALID_HANDLE_VALUE)
        return;

    MINIDUMP_EXCEPTION_INFORMATION exceptionInfo;
    exceptionInfo.ThreadId = GetCurrentThreadId();
    exceptionInfo.ExceptionPointers = e;
    exceptionInfo.ClientPointers = FALSE;

    MiniDumpWriteDump(
        GetCurrentProcess(),
        GetCurrentProcessId(),
        hFile,
        MINIDUMP_TYPE(MiniDumpWithIndirectlyReferencedMemory | MiniDumpScanMemory | MiniDumpWithFullMemory),
        e ? &exceptionInfo : NULL,
        NULL,
        NULL);

	if(hFile)
	{
		CloseHandle(hFile);
		hFile = NULL;
	}
    return;
}

LONG CALLBACK unhandled_handler(EXCEPTION_POINTERS* e)
{
    make_minidump(e);
    return EXCEPTION_CONTINUE_SEARCH;
}

int main()
{
    SetUnhandledExceptionFilter( unhandled_handler);
	DWORD dwThreadID = 0;
	HANDLE hThread = CreateThread(NULL, 0, (LPTHREAD_START_ROUTINE)func, NULL, 0, &dwThreadID);
	if(hThread == NULL)
	{
		return 1;
	}
	WaitForSingleObject(hThread, INFINITE);
	return 0;

}

DWORD WINAPI func()
{
	int *p = NULL;
	*p = 10;
	return 0;
}
This is the same example from Part 1, with a slight deviation of adding a thread that will crash. After executing this code the Dump file will be generated in the %Appdata% folder.
Launch Windbg, set the symbols and analyze you should get the following.
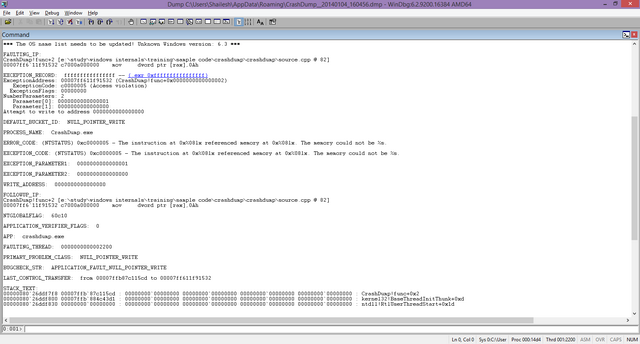
So here we see some interesting facts:
- DEFAULT_BUCKET_ID: NULL_POINTER_WRITE, since we are writing to a NULL Pointer
- CrashDump!func+2 [e:\study\windows internals\training\sample code\crashdump\crashdump\source.cpp @ 82]
This is exactly the line number on which the crash happened
- Stack Trace
00000080`26ddf7f8 00007ffb`87c115cd : 00000000`00000000 00000000`00000000 00000000`00000000 00000000`00000000 : CrashDump!func+0x2
00000080`26ddf800 00007ffb`884c43d1 : 00000000`00000000 00000000`00000000 00000000`00000000 00000000`00000000 : kernel32!BaseThreadInitThunk+0xd
00000080`26ddf830 00000000`00000000 : 00000000`00000000 00000000`00000000 00000000`00000000 00000000`00000000 : ntdll!RtlUserThreadStart+0x1d
This gives the stack trace of the faulty thread and not the one starting from the main.
Summary
So with this we now know to add the code to our application, which will generate dump whenever the application crashes. As a thumb rule this should be part of any application that is being developed.
History
- 2014-01-09: Article upload
- 2014-01-20: updated with links to other parts
- 2014-01-27: updated with Definition for Mini Dump and Full Dump
- 2014-01-30: updated the Definition for Dump
A Technology Enthusiast since 14 Years, have been contributing in varied Domains. Interested in developing technology which goes more meaning to Human Life, Nature and the entire ecosystem.
#Developer, #Architect, #Enthusiast, #Contributor #Mentor
To all Developers out there, You touch a Billion Lives a Billion Times
Before you code Think Twice !!!


 General
  News
News  Suggestion
  Question
  Bug
Bug  Answer
  Joke
Joke  Praise
  Rant
Rant  Admin
Admin 


