
LeakDiag – An Effective Memory Leak Analysis Tool
4.56/5 (6 votes)
Tool to detect memory leaks in C++ application
Introduction
Memory leak problems are relatively complex and challenging when the code base is huge and complex, the problem increases if our application is running on server for multiple days. As this is very common problem with C++ code, there are many tools developed to analyze memory leaks, such as Rational Purifier, Bounds Checker, but these tools are not freely available. If you want to find memory leaks in your program without investing in such tools, then please go ahead and read this article.
Where Should I Get This Tool?
This is a tool developed and distributed by Microsoft and is freely available on Microsoft’s FTP at ftp://ftp.microsoft.com/PSS/Tools/Developer%20Support%20Tools/LeakDiag/. Download and install this tool on the system where our application is running. (This might be your desktop or a server machine.)
What is LeakDiag ?
This is freeware used to detect memory leaks in small as well as large scale enterprise applications, very simple and handy to use. We can use this tool to find memory leaks of simple EXE as well as Windows Service; the good thing here is I need not stop the application to start leak analysis. The output of this tool is an XML file which contains all stack frames that have allocated the memory and not freed up at the time of snapshot. We will see this procedure in detail below. We need to do some initial settings before we actually start collecting logs.
Initial Settings
The first thing we need to do is to set public symbol path (srv*c:\symcache*http://msdl.microsoft.com/download/symbols). Go to open the tool and go to tools -> Options. Set the public symbol path as well as your local symbol path here, refer to the below figure:

The check box Resolve symbols when logging states whether we want to resolve the symbols at the time of logging or not. This option can be checked if our application is small and doesn’t acquire much of RAM, but for applications which use huge memory space and which run on server for a long time, resolving symbols at the time of logging will not be a good option as the system hangs while collecting the stack frames and resolving symbols for each of them (In large scale applications, there can be large number of stack frames which doesn’t). I suggest to resolve symbols later so do not check this checkbox. You also need to mention the log file path where you want to store the generated logs. Click Ok and you are done with initial required settings.
Attaching to a Process
The main window of LeakDiag will look like below:

Here in the list box, you will see all the available processes as how we could see them in Task Manager, and there is another list which asks about Memory Allocators. Below are the meanings of all listed allocators:
- Virtual Allocator (
VirtualAlloc) - Windows Heap Allocator (
HeapAlloc)[DEFAULT] - COM Allocator (
CoTask) - C Runtime Allocator (
msvcrt new) - TLS Slot Allocator (
TlsAlloc)
Out of all above allocators, the important ones are Windows Heap Allocators and COM Allocators, which cause leaks in most of the cases. We can select more than one allocator as well at a time by pressing ctrl key.
Now after selecting the appropriate allocator, click Start to start the analysis of your code, after some tome and interval, take the snapshot of stacks by clicking log button and the LeakDiag will take some time to log as per the selected option (Resolve Symbols). We can take snapshots after fixed interval by clicking log button. This will collect all stack frames which have allocated the memory and are not freed up till then. We should take as many snapshots as possible, more the snapshots it is easier to find out the leaking stacks. We can also automate the process of snapshots taking by modifying autodiag.ini, this file you can find in the folder where the LeakDiag is installed. Also this setting can be done by modifying the registry key as below:
HKEY_LOCAL_MACHINE\SOFTWARE\Microsoft\LeakDiag\EnableAutoDump
This key lets you enable or disable the Auto Dump Feature.
HKEY_LOCAL_MACHINE\SOFTWARE\Microsoft\LeakDiag\AutoDumpInterval
This key lets you select the interval at which you want the logs to be generated.
Okay, now we have logs collected after regular interval and its time to analyze the logs.
Analyzing Logs
Before we go for analyzing the logs, if we have not resolved the Symbols (The checkbox I mentioned in the above section), then this is a time to do it. Open a command prompt and go to the installed folder of LeakDiag, then run the sdecode.exe command to check the usage, you will find below usage-
sdecode /z <path to .dmp file> [/y <sympath>] [/i <imagepath>] inputfile outputfile
i.e.:
sdecode /z c:\memtest.dmp /y c:\winnt;srv*\\symbols\symbols Log123.xml NewLog.xml
This utility is very useful as we can collect the unresolved stack frames without any performance impact on the process and later we can resolve symbols of it. Remember that the naming convention of files should not be modified or else we will not be able to analyze them using LDParser or LDGrapher.
There are three ways we can analyze the logs in XML file.
1. XML Reading and Manually Analyzing Them
This is a little trick and time consuming process of analyzing the stack frames but this gives us the clear and better picture of leaks in process, mastering in reading XML files will make it easier to understand the LDParser and LDGrapher tools as well.
The XML mainly consist of three sections:
- Schema of XML
LEAKStag, in which all the stack frames with memory allocated in it and not freed are includedSUMMERY_INFOtag, this tag contains some process and memory info and modules included in a process
See the stack frames in the second section. This section contains multiple STACK tags which mention the stack frames:
<STACK numallocs="05" size="015833497" totalsize="079167488">
<STACKSTATS>
<SIZESTAT size="01048576" numallocs="01" type="MEM_RESERVE"/>
<SIZESTAT size="02097152" numallocs="01" type="MEM_RESERVE"/>
<SIZESTAT size="0524288" numallocs="01" type="MEM_RESERVE"/>
<ASSOCIATED_STACKS stackid="23AB8548" type="MEM_COMMIT"
	numallocs="02" totalsize="024575"/>
<ASSOCIATED_STACKS stackid="1F9C3EE8" type="MEM_COMMIT"
	numallocs="01" totalsize="024576"/>
<ASSOCIATED_STACKS stackid="1F9C4008" type="MEM_COMMIT"
	numallocs="01" totalsize="012288"/>
</STACKSTATS>
<FRAME num="0" dll="" function="" offset="0xC0DECAFE"
	addr="0xc0decafe" filename="" line=""/>
<STACKID>23AB40E8</STACKID>
</STACK>
Total size allocated by stack is shown in the above highlighted portion in size and totalsize. ASSOCIATED_STACKS shows all associated stacks in that region; with little more intelligence we can read the affected stacks from multiple files (one file per screenshot, the logs which we have created above) identified by STACKID and see where the actual leak is happening. For this, we need to take multiple files and track each stack in these files one by one, if the totalsize of stack value goes on increasing or even if it is remaining constant for a long time, then we can take that stack as a doubtful stack and check if memory allocated by that particular stack is getting freed correctly. Repeat the above process with all stacks which are having high total size value and track the leaks accordingly, you might find this process a little tedious but once you master it, this will be a best process you can find.
Alternately, you can also write a script which will parse the XML for you and create an XSL file; many experienced developers follow this technique.
2. LDParser
This is tool we can use to parse the generated XML files and see the data in tabular format; I searched it on web but couldn’t get it.
3. LDGrapher
This is a redistributable tool provided by Microsoft and is available on Microsoft FTP server. We can install this on our local and provide the generated XML files as an input and this tool will give us the graphical representation of our stacks as shown below.
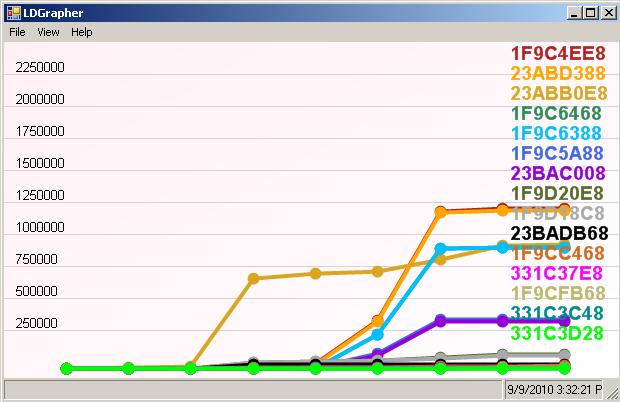
Here LDGrapher picks up most affected stacks and shows it to us with different colors. We can double click on any line to open the corresponding stack and see what the start point of that allocation is.
To see the stacks in LDGrapher, we need to select only one type of allocation and the subsequent screenshot files of that allocation, or else we will not be able to see any output.
I hope this is pretty much for LeakDiag and don’t hesitate to add any new information if you find it.
History
- 10th September, 2010: Initial post