Introduction
YouTube
In modds Drag and Drop Programming for C# Sample Program (Part 1), I described a sample command line program. In this second part, I will show you how to create a Stock Chart program.
In this example, I create a program that will first retrieve stock prices from YAHOO! Historical Prices and then display a stock price chart.
Project Requirements
- modds C# Designer (from www.modds.org)
- Microsoft Visual Studio (for creating DLL from attached file)
- Window 7 or above
- .NET Framework 4.5.2 or above
Download the attached files and compile them with Microsoft Visual Studio to create WPF Chart Control and Market Data API.
I was not able to find a good free WPF Financial Charting. So I wrapped the Microsoft WinForm Chart to WPF control. This will serve as third party WPF Financial Charting.
In the attached file, there is a file named “MarketDataView.xaml”. This is the WPF user interface text file I designed for Stock Chart program using the WPF Chart Control created above. In .NET, this XAML file can create a User Control at run-time. The User Control Symbol Name, Start Date, End Date and Search button fields are data binding to back end object by the object property name.
In the attached example files, I also include a MarketData project. It has only one class, YahooMarketData, which retrieves market data from Yahoo!. This will serve as the third party Market Data API.
You can use modds Designer to open the Stock Chart project (in the attached file modds/StockChart/Application.moddc) to see the running program.
Designing the Stock Chart Program
Create WPF Application
- Start modds Designer
- Create Window Application Project
- From New Project dialog
- Select Windows Application
- Given Project Name “Stock Chart”
- Browse Project Path
- Press OK
Add .NET DLL and WFP View Files to Project
- Right click on Solution->Stock Chart->References->ProgramDLL and select Add Item.
- Add (download attached file) ChartControl.dll
- Add (download attached file) MarketData.dll
- Right click on Solution->Stock Chart->SchemaView->MainWindow.xaml and select Delete to delete MainWindows.xaml.
- Right click on Solution->Stock Chart->SchemaView and select Add Item
- Add (download attached file) “MarketDataView.xaml”
Design Application
- Double click on Solution->Stock Chart->Schema->MainWindow.xaml to open.
- Delete View, Message, ButtonCommand, and HelloWorld element .
- Drag in Solution->Stock Chart->SchemaView->MarketDataView.xaml (name it View)
Now the program should run but it does not do anything yet. To test it, right-click Solution-> Stock Chart and select Debug.
In the .NET DLL Toolbox panel, click on Add DLL button (left top corner) and in the file Open panel, add (download attached file) “MarketData.dll”.
Drag the following to the design board:
- Control Toolbox->WPF Controls->Command (name it
SearchCommand) - .NET DLL Toolbox->MarketData.dll->Class->YahooMarketData->YahooDailyMarketData
- .NET DLL Toolbox->
CSharpCommonLibrary->Primitive Type->String (name it Symbol) - .NET DLL Toolbox->
CSharpCommonLibrary->Class->DateTime (name it StartDate) - .NET DLL Toolbox->
CSharpCommonLibrary->Class->DateTime (name it EndDate) - .NET DLL Toolbox->
CSharpCommonLibrary->Primitive Type->Double (name it Open and set it to Array) - .NET DLL Toolbox->
CSharpCommonLibrary->Primitive Type->Double (name it High and set it to Array) - .NET DLL Toolbox->
CSharpCommonLibrary->Primitive Type->Double (name it Low and set it to Array) - .NET DLL Toolbox->
CSharpCommonLibrary->Primitive Type->Double (name it Last and set it to Array) - .NET DLL Toolbox->
CSharpCommonLibrary->Primitive Type->Double (name it AdjClose and set it to Array) - .NET DLL Toolbox->
CSharpCommonLibrary->Primitive Type->Double (name it Volume and set it to Array) - .NET DLL Toolbox->
CSharpCommonLibrary->Class->DateTime (name it Date and set it to Array)
Drag connection lines as shown in the following diagram
:
The stock price WPF control takes a group of price arrays (date, open, high, low, and last). To create StockPrice, we need to group those stock prices into a single object.
In the Properties panel, click the refresh button (left top corner).
Drag the following to the design board:
- Control Toolbox->modds Standard Controls->Toolbox->Group Data (set number data to 5 and set first input to trigger Connector).
- Properties->
DataObject->Date - Properties->
DataObject->Open - Properties->
DataObject->High - Properties->
DataObject->Low - Properties->
DataObject->Last - .NET DLL Toolbox->
CSharpCommonLibrary->Class->Object (name it StockPrice and set it to Array)
Drag the connection lines as shown in the following diagram:
In here, the controls: Date, Open, High, Low and Last are copied controls. These are used to break a large complex graphic into smaller graphic according to functionality. They can also be used to avoid crossing lines. At run-time, all copied controls are ignored and any connections made to copied controls will be “reconnected” to the original controls.
In Group Data Control, we set Date as a trigger connector because on YahooDailyMarketData function, the date is last value get triggered. Therefore, when the date is ready, this implies all Open, High, Low, and Last data are ready as well.
Initialize StartDate and EndDate.
Drag the following to design board:
- Control Toolbox->modds Common Controls->Module->Start Trigger
- .NET DLL Toolbox->
CSharpCommonLibrary->Class->DateTime->get_Now() - .NET DLL Toolbox->
CSharpCommonLibrary->Class->DateTime->AddMonths(Int32) (set months to -3)
Drag the connection lines as shown in the following diagram:
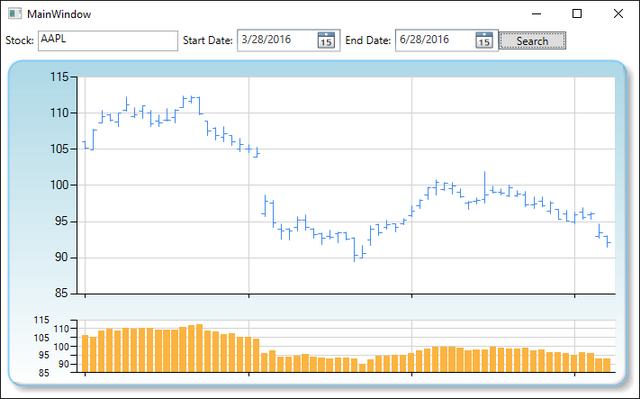
Now the Stock Chart program is complete. Right click on Solution->Stock Chart and select Debug to start running the project. Enter a stock symbol, start time, end time, and press Search.
modds Drag and Drop Programming for C# Sample Stock Chart Auto Completion (Part 3)
This member has not yet provided a Biography. Assume it's interesting and varied, and probably something to do with programming.


 General
  News
News  Suggestion
  Question
  Bug
Bug  Answer
  Joke
Joke  Praise
  Rant
Rant  Admin
Admin 


