Introduction
Following are the steps to debug the Visual Studio designer for WinRT Projects.
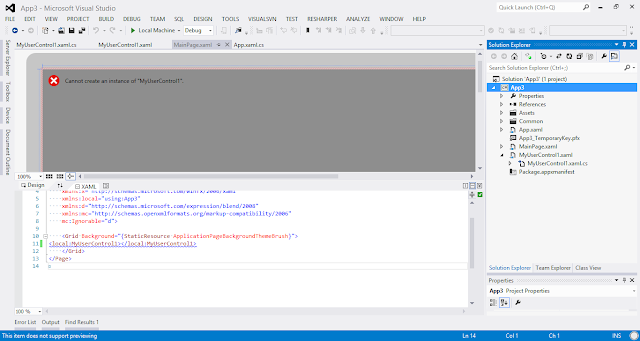
- Open the WinRT Project that designer needs to debug:
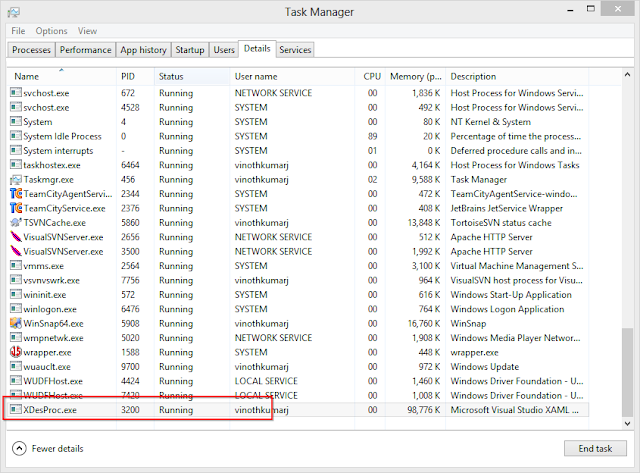
- Note the XDesProc process id from the TaskManager as shown in the below image:
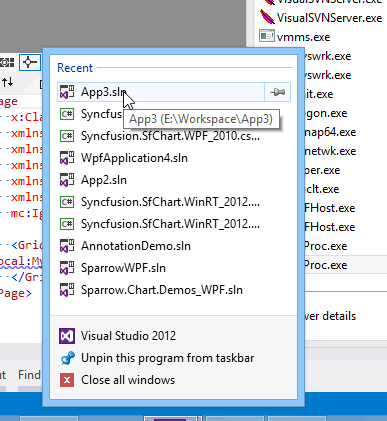
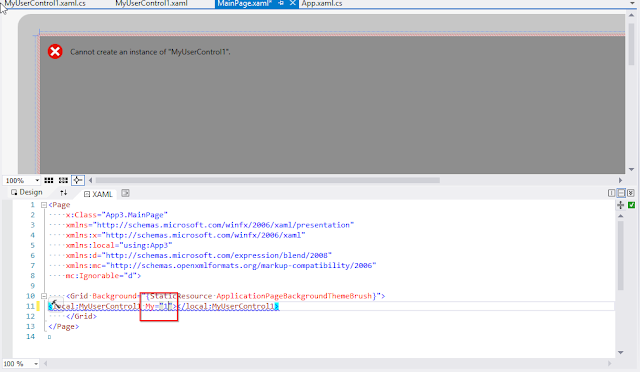
- Open the same solution in another window:
- Note the New XDesProc process id from the taskmanager that the designer process needs to debug:

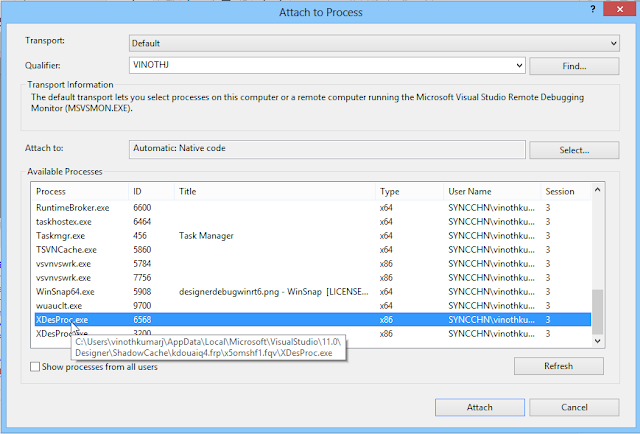
- Go to Debug->Attach To Process in Visual Studio 2012 from the FirstSolution:
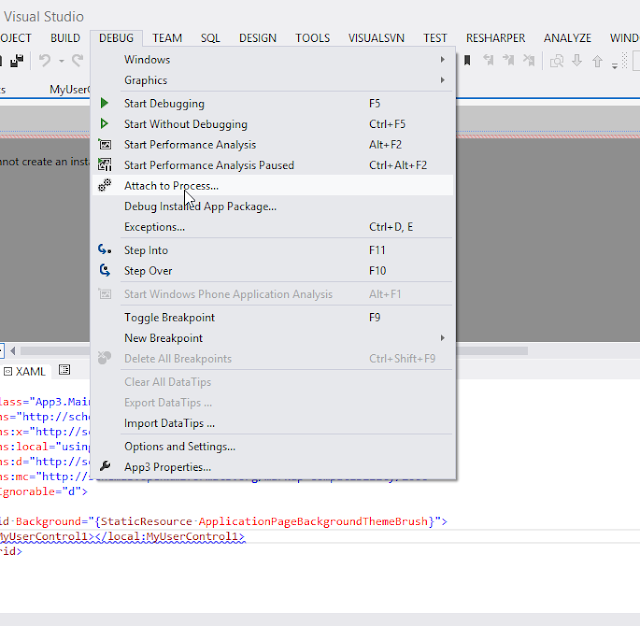
- Select the new XDesProc process from the Window:
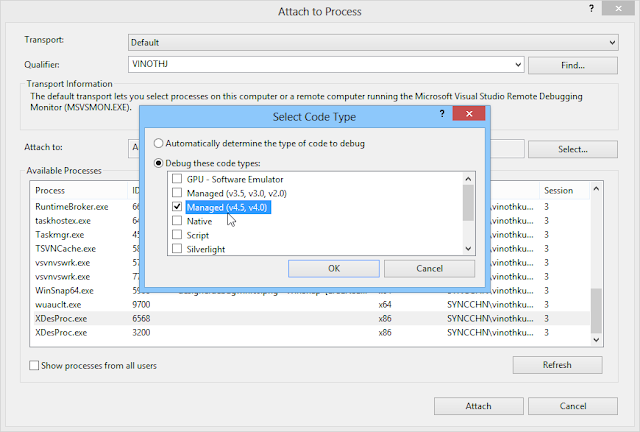
- Before clicking Attach, it is important to change the Attach To ->Managed 4.0,4.5 from the Select Button:
- Boom! Your BreakPoints in the FirstSolution got hit:
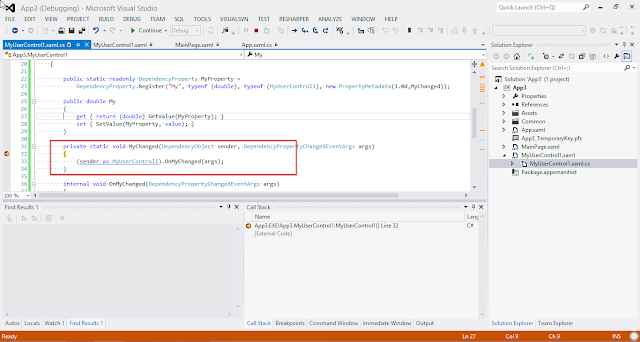
Now you can play with the designer.


 General
  News
News  Suggestion
  Question
  Bug
Bug  Answer
  Joke
Joke  Praise
  Rant
Rant  Admin
Admin 


