
RDLC Report Grouping with Page Break, Table Header Repeat, Group Totals and Sub Grouping
4.86/5 (23 votes)
RDLC Report Grouping with Page Break for each Group Type, Table Header repeat for each page and Report Totals
Introduction
Grouping is a critical aspect when it comes to detailed reports or complex report generating. There are many importance that a report has grouping. In this article we are going look some great things with report grouping.
Background
Well this article doesn't have any advance stuff, I am going step by step in creating report and on. But for some this might not suit enough to learn very basic. But I think this is good enough. Let’s see,
Creating The Report
Database table structure which use for demo;

Open Visual Studio, here I am using Visual Studio 2012. Create an empty web application. If you want the report in Windows Application go on by creating Windows Application.
Adding DataSet
Once
you get your project ready, let’s create the DataSet. DataSet provide disconnected
representation of a result from an original database.
So right click on Project -> Add New Item
From
the new window opened, select Data Tab from left side panel. Then Select
DataSet.

After
that right click on the data set designer and select Add -> TableAdapter.

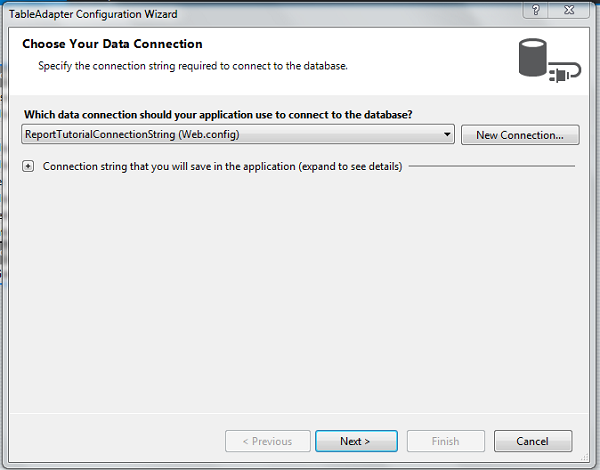
Then TableAdapter Configuration Wizard window will open.
If
you are creating reports in a new project which doesn't have any data base
connection strings on web.config you need to create a new connection.
For that click New Connection Button,

Then Add Connection window will open.
Enter your server name. If you are using local machine it will be your Machine Name. But if it is a remote server you need to put server name. Any how you couldn't find server name you only need to right click on server in Ms Sql Server -> Properties. Then you find the server name as Name.

Once you enter Server Name your databases will populate in to drop down in Connect To a Database Group. Then Select your database.

Then Click OK.
From the next screen Tick "Yes, Save the connection as:" so you don't have to set it again. This will save your Connection in Application Configuration file.

Then Click Next,
But if you already have your connection, just select the connection and click Next.
From the next screen you need to Choose your command type. Whether you are going to get data from a Sql Query or to create a Stored Procedure or Choose a already created stored procedure in database. I have already created my stored procedure in my data base. So I am going to select "Use existing stored procedure"

Then Click Next, from next screen select your stored procedure and click Finish.

Now
you can see you TableAdapter in DataSet Designer.

If you need to preview data in Data Set.
Right Click on Table Adapter and select Preview. If your Stored Procedure needs parameters to pass you need to pass them. But in my case it doesn't take any parameters. Click Preview.

If you are using a stored procedure with parameters the approach might be different. Since this article is regarding Report Grouping I won't go in to that complex.
Adding Report Viewer
Your dataset is ready to use. Now let’s see how to create the report.
For
that you need to create a new WebForm and insert a ReportViewer on to page.

Then
you need to insert the Ajax Script Manager to page. ReportViewer needs script
manager in order to make server calls. Drag and drop Ajax Script Manager from
tool box.

Now in Page Html Source page or designer page select more option icon on report viewer..
If in Source Page click report viewer tag,

If in Designer Page click report viewer.

From that select "Design a New Report"
Then Report Wizard will open.
In
Report Wizard select created dataset (DataSet1) and Table Adapter. Then click
Next.

Then from next screen select all the Fields in 'Available Fields' box and drag and drop them to 'Values' box. Choose the fields that you need to be in the report only. Then click Next.

From the next screen select the report style. I prefer Ocean.
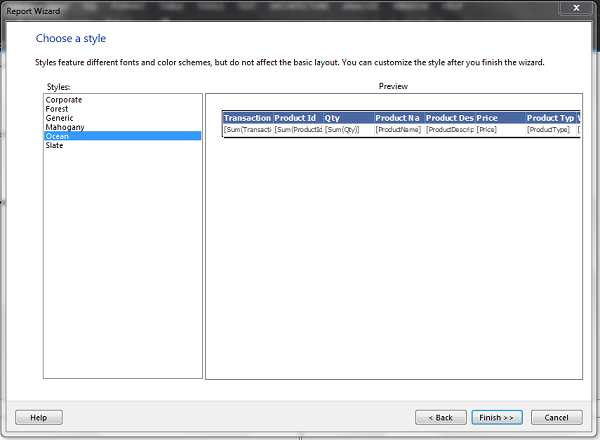
Now your report looks like this.

Align your report and make it looks nice and cool.
Now let’s set the report to ReportViewer. For that select more option in report viewer and select choose a report.


Adding Report Header that Repeats in every page
Now let’s create the Reports header that needs to be display in every page.
Right Click on Report body -> Insert -> Page Header.

Insert a report heading and any details that you need to display in report header. You can use report tools panel in left hand side.
Then let’s set the report properties that makes report display in every page.
For that Right Click on report header -> Header Properties.

In general tab tick the options as follows.

Report Grouping
Following data returns from my Stored Procedure and binds them to my report.

I need to Group my data from Product Type and Warehouse.
Let’s start the Report Grouping.
Right Click on the report details row and select Add Group -> Parent Group. Give any relevant name to the group.

Now
at the bottom of the page you see Row Groups. And it has Group1 and Details.
Right
Click on Group1 and select Group Properties.

From the Group Properties window select General Tab. Then select the field that needs to be group from Group on. In my case I select "Product Type"

Then select Page Breaks tab in the same window.
Check the "Between each instance of Group" and click OK.

Now you can see a new column has added to the Table.
In newly added columns select the cell. Now you can see a small icon at the top right in the cell. Click it and select the field that need to be group (in my case it’s Product Type).


Run the project.
Now you can see that report has break in to several pages group type wise.
Here is mine. You can see the pages of the report in report viewer control panel.

Repeating Table Header in every page
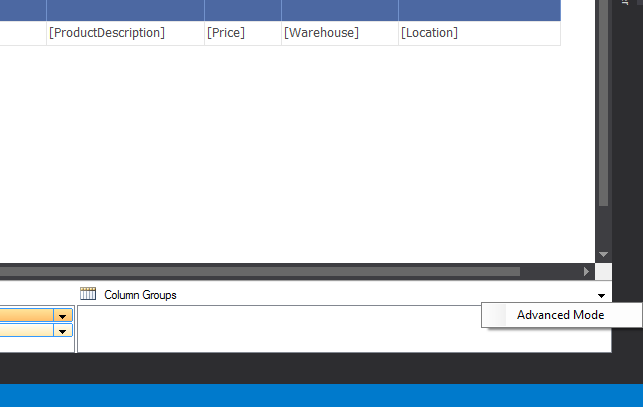
Now we need to repeat the Table header as well.
For
that you need to click the Arrow in right bottom of the editor and Click
Advance Mode.
Now you can see two more Grey rows as Static in Row Groups.

Click on the Top Static Row and Navigate to Property panel.
Change
the "KeepWithGroup" property to 'After' and
"RepeatOnNewPage" property to 'True'


Run the application.
You must see that Table header also have repeated.

Report Sub -Grouping
Now we are going to have another child group that group warehouse wise.
For that Right Click on the Group1 -> Add Group -> Child Group

Give a relative name to group and add it.
Now
as like earlier select the icon on newly added columns cell and select field
that need to group. In my case it's Warehouse.

Report Sub -Grouping
Now go to child group properties and change the "Group On".


Run the application and see.

Report Totals Row
Now let’s add a Total of Qty column group wise. In my case I need the Product wise total.
For that Right Click on the Child Group cell -> select Add Total -> After.

Now you can see that new Row added to table. Deleted non relevant cells.

It’s the same to get the Total Product Sum which needs to come on last page. Right Click on the Parent Group cell -> Add Total -> After.

You can do the Report Styling as you prefer from the tool bar at the report designer top.
Final Out Come
Now let’s see the Final Report.

Page HTML source code.
<%@ Page Language="C#" AutoEventWireup="true" CodeBehind="Index.aspx.cs" Inherits="BlogReport.Index" %>

<%@ Register Assembly="Microsoft.ReportViewer.WebForms, Version=11.0.0.0, Culture=neutral, PublicKeyToken=89845dcd8080cc91" Namespace="Microsoft.Reporting.WebForms" TagPrefix="rsweb" %>

<!DOCTYPE html>

<html xmlns="http://www.w3.org/1999/xhtml">
<head runat="server">
    <title></title>
</head>
<body>
    <form id="form1" runat="server">
        <asp:ScriptManager ID="ScriptManager1" runat="server"></asp:ScriptManager>
        <div>
            <rsweb:ReportViewer ID="ReportViewer1" runat="server" Font-Names="Verdana" Font-Size="8pt" WaitMessageFont-Names="Verdana" WaitMessageFont-Size="14pt" Width="1100px">
                <LocalReport ReportPath="Report2.rdlc">
                    <DataSources>
                        <rsweb:ReportDataSource DataSourceId="ObjectDataSource1" Name="DataSet1" />
                    </DataSources>
                </LocalReport>
            </rsweb:ReportViewer>
            <asp:ObjectDataSource ID="ObjectDataSource1" runat="server" SelectMethod="GetData" TypeName="BlogReport.DataSet1TableAdapters.ProductTransactionsTableAdapter"></asp:ObjectDataSource>
        </div>
    </form>
</body>
</html>
Points of Interest
Google Search results of creating RDLC reports.
https://www.google.lk/search?q=how+to+create+rdlc+reports+in+asp.net&oq=How+to+cre&aqs=chrome.0.69i59j69i57j69i60l2j0l2.6655j0j7&sourceid=chrome&es_sm=122&ie=UTF-8
What is RDLC report?
- RDLC is a client side reporting, Reports are deployed with the applications (windows app or web app).
- Limited functionality in exporting the report.
- Report's data processing and rendering needs space of the hosting application where Reports are hosted.
- Has performance issue since the report data in process at the report.