
Office Web Components - Line Graph (Date as X-Axis)
This is an article about using line graph in Office Web Components, where date is used in the X-Axis.
Introduction
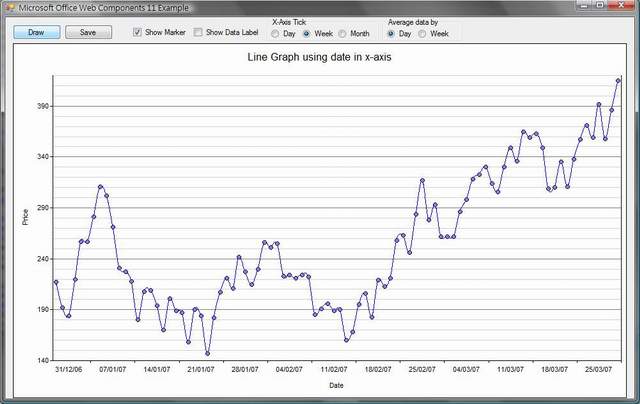
Recently, I had to plot a graph in a Windows Application. The graph was an ordinary line graph, with X-Axis in date and Y-Axis in price (decimal). After a little bit of searching, I found Office Web Components, which I think, should suit my needs. Because this is my first step in OWC, I spent much time in building the X-Axis (date), and the OWC just gave me strange results. (The y values are plotted, but sum up every 7 days.)
After carefully searching and studying the merely discrete examples in the web, I solved the problems and I am writing an article to group my findings.
Background
Office Web Components are a collection of Component Object Model (COM) controls for publishing spreadsheets, charts, and databases to the Web. But it can be used in Windows Application too. You can download it from the Microsoft download center.
After installation, you have to add the reference named (Microsoft Office Web Components 11.0) to your project as well as your toolbox.
Using the Code
Although I built my project in Visual Studio 2008, the code relating to OWC is absolutely applicable in .NET 2.0. I will describe the whole process in building the line graph here.
Prepare the Source Data
There are different methods in preparing and feeding the data into OWC. Many examples use a comma-seperated value, e.g. Jan,Feb. However, I prefer using Array, you can set an OBJECT ARRAY to the series using the function SetData. (Well, it MUST be an OBJECT ARRAY, other types of arrays does not work!)
Assuming that you have the graph values, you have to convert them to object array. (I am lazy, so, I use LINQ.)
Why do I use yyyy-MM-dd as the format? The answer is simple, I don't want OWC to mix up dd/MM/yyyy and mm/dd/yyyy.
Dim XValues As New List(Of DateTime)
Dim YValues As New List(Of Double)
Dim xObjects, yObjects As Object()
Dim tmp = From x In XValues Select CObj(x.ToString("yyyy-MM-dd"))
xObjects = tmp.ToArray()
Dim tmp2 = From y In YValues Select CObj(y)
yObjects = tmp2.ToArray()
I prefer manual calculation for the maxima and minima of the y-Axis of the graph.
'Determine maxima and minima of Y
Dim yMax As Decimal = YValues.Max()
Dim yMin As Decimal = YValues.Min()
yMin = Math.Floor(yMin / 10) * 10 'Round the minimum to standard number
yMax = Math.Ceiling(yMax / 10) * 10 'Round the maximum to standard number
Creating the Chart Body
In Windows application, pull a control named Microsoft Office Chart 11.0 from the toolbox, and it should be named AxChartSpace1 in the form.
Remove the charts in the control using the following code. (Why is there no Clear() method?)
If AxChartSpace1.Charts.Count > 0 Then AxChartSpace1.Charts.Delete(0)
The following code prepare the chart body. (Sorry, I am going to use lots of With statement here.)
Dim chart As ChChart = AxChartSpace1.Charts.Add()
With chart
.HasTitle = True
.Title.Caption = "Line Graph using date in x-axis"
.Title.Font.Name = "Arial"
.Type = ChartChartTypeEnum.chChartTypeSmoothLine
.PlotArea.Interior.SetSolid("White")
End With
Series
We are going to set the Series data (The X, Y valeus data), using the SetData commands.
For X Axis, use ChartDimensionsEnum.chDimCategories.
For Y Axis, use ChartDimensionsEnum.chDimValues.
And then put the X, Y object values that you have created earlier here.
Dim series As ChSeries series = chart.SeriesCollection.Add(0)
With series
.Name = "Series 1"
.Caption = "Caption 1"
.SetData(ChartDimensionsEnum.chDimCategories, _
	ChartSpecialDataSourcesEnum.chDataLiteral, xObjects)
.SetData(ChartDimensionsEnum.chDimValues, _
	ChartSpecialDataSourcesEnum.chDataLiteral, yObjects)
.Line.Color = "Blue"
.Line.Weight = LineWeightEnum.owcLineWeightThin
End With
Data Labels
Sometimes you want to add data labels or markers to the graph.
With series
.DataLabelsCollection.Add()
.DataLabelsCollection(0).Font.Name = "Verdana"
.DataLabelsCollection(0).Font.Size = 8

.Marker.Style = ChartMarkerStyleEnum.chMarkerStyleCircle
.Marker.Size = 6
End With
Configuring X-Axis (Important)
Recall that I encountered a strange problem when using date as X-Axis. The problem is that the Y values are all summed up every 7 days. This strange behavior can in fact be adjusted manually in the X-Axis, after modifying the GroupingType, GroupingUnit and GroupingTotalFunction properties. The default GroupingUnit is 1 week and the GroupingTotalFunction is SUM. That's why such behavior is resulted when nothing is set in advance.
I have seen many web examples use chart.Axes(0) as X-Axis. Personally, I am not comfortable with it, please use chart.Axes(ChartAxisPositionEnum.chAxisPositionCategory) instead.
Also, to avoid the crowd tick in X-Axis, you can set the tick to display weekly but not daily.
With chart.Axes(ChartAxisPositionEnum.chAxisPositionCategory)
.HasTitle = True
.Title.Caption = "Date"
.Title.Font.Name = "Arial"
.Title.Font.Size = 8
.Font.Size = 8
.Font.Name = "Arial"
.NumberFormat = "dd/MM/yy"

.GroupingType = ChartAxisGroupingEnum.chAxisGroupingManual
.GroupingUnitType = ChartAxisUnitTypeEnum.chAxisUnitDay
.GroupingUnit = 1
.GroupingTotalFunction = ChartGroupingTotalFunctionEnum.chFunctionAvg

.TickLabelUnitType = ChartAxisUnitTypeEnum.chAxisUnitWeek
.TickMarkUnitType = ChartAxisUnitTypeEnum.chAxisUnitWeek
End With
Configuring Y-Axis
The Y-Axis is straightforward, put the Maxima and Minma that you have calculated earlier here. Also, set the major and minor grid lines.
For Y-Axis, use chart.Axes(ChartAxisPositionEnum.chAxisPositionValue).
With chart.Axes(ChartAxisPositionEnum.chAxisPositionValue)
.HasTitle = True
.Title.Caption = "Price"
.Title.Font.Name = "Arial"
.Title.Font.Size = 8
.Font.Size = 8
.Font.Name = "Arial"

.Scaling.Maximum = yMax
.Scaling.Minimum = yMin

.MajorUnit = 50
.MajorGridlines.Line.Color = "Gray"

.MinorUnit = 10
.MinorGridlines.Line.Color = "LightGray"
.MinorGridlines.Line.DashStyle = ChartLineDashStyleEnum.chLineSolid
.HasMinorGridlines = True
End With
Finish and Export
If you have configured correctly, you should have seen a Line graph with data point plotted every day, and a weekly X-Axis tick label. If you would like to export your graph to a file, Microsoft provides an easy way using the following code. You can set the rendering file format (JPG, GIF) and the image size.
Dim filePath As String = System.IO.Path.GetTempFileName() & ".gif"
Dim chartBytes As Byte() = AxChartSpace1.GetPicture("GIF", 1280, 960)
System.IO.File.WriteAllBytes(filePath, chartBytes) 'Save to image

Dim process As New System.Diagnostics.Process()
process.Start(filePath)
Points of Interest
I understand that it's difficult to use OWC at first, because OWC does not have a comment in both functions and properties. Sometimes, I have to open Microsoft Excel to understand what it means. Also, I have tried hard to include the properties that would be used commonly in this article, and hope it can help the beginner in OWC.
If you are using .NET 3.5, you can try "Microsoft Chart Controls for Microsoft .NET Framework 3.5" which is a new chart control written by Microsoft.
This is my first article on CodeProject. I learned a lot from CodeProject in the past, and this time, I would like to contribute my findings to all of you.
History
- 6th September, 2009: Initial post