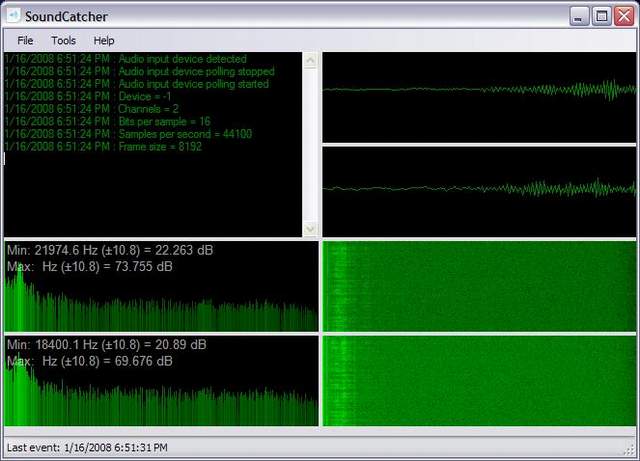
 |
|
 |
This is a known issue with the wave library. Compile it using the x86 instruction set and it should work fine.
|
|
|
|
 |
|
 |
I'm not sure about this but I suspect there's a problem with your frequency spectrum. I've set your 'test' flag to true so that it works on a simple sine wave and the spectrum shows a dominant frequency with side content indicating the presence of other frequencies which simply aren't there. You should see a _single_ spike in the spectrum corresponding to the frequency of the sine wave being transformed. Otherwise, great job
|
|
|
|
 |
|
 |
What frequency? I think I may have corrected this in a later revision that I didn't post. It was a rounding error in drawing the wave if I remember correctly. I'll try to find the correction and post it here. Thanks for the constructive critcism.
|
|
|
|
 |
|
 |
I did have another thought I'll need to check...to get the single spike in the freq domain you'll need an integral number of sine wave cycles in your sample window otherwise you will see some other spurious frequency content (not sure if that is what we are seeing).
|
|
|
|
 |
|
 |
Hi, Mr. Morton!
My groupmates and I have a project in which we aim to get the the person's voice frequency so that we could tell his/her vocal range (i.e. Soprano, Alto, Bass, Tenor). We are very interested in your project here, and we would like to utilize some of your techniques. We were just wondering how we could get the frequencies. Instead of displaying it on the screen, how could we get the frequencies of the voice each second and could we possibly put the values in an array or arraylist? If so, could you help us locate the specific part of your code that could help us accomplish this?
Thank you for your time, and I hope for your reply
|
|
|
|
 |
|
 |
hi,
We have the same project, getting the persons voice frequency and analyzing their vocal range.
I would like to ask on what algorithm you are using for the project?. How would you get the voice ranges?
Thanks.
Hazel
|
|
|
|
 |
|
 |
Sounds great.
I was considering messing around with voice detection as well, although there is no serious analysis occuring in this project since I'm just triggering an event based on an amplitude threshold and not actually detecting voice.
All of the basics are covered in this project though. You would just need to elborate on what's here already.
If you succeed please upload your project so others can learn from it. I know I would be interested in seeing the results myself.
|
|
|
|
 |
|
 |
Jeff, can you help us!
How can we get the frequency each time fft is calculated?
aF was here -.-
|
|
|
|
 |
|
 |
I allready know :P
The fundamental frequency at a moment it's the maximum frequency that we get from fft
aF was here -.-
|
|
|
|
 |
|
 |
Then it would be nice if you share it with us.
|
|
|
|
 |
|
 |
Hi all,
this is a question similar to the previous:
anybody knows how can we change the audioin device from microphone to an existing wav file so we can plot the spectrogram of this file and ignore any input from the microphone?
I've played around with the FormMain.cs line
"_recorder = new WaveInRecorder(Properties.Settings.Default.SettingAudioInputDevice, _waveFormat, Properties.Settings.Default.SettingBytesPerFrame * Properties.Settings.Default.SettingChannels, 3, new BufferDoneEventHandler(DataArrived));"
and tried to change the "Properties.Settings.Default.SettingAudioInputDevice" to an integer but didn't work. I guess is not that simple.
Thanks for a great code
plouvou
|
|
|
|
 |
|
 |
I am interested in processing wave file for spectrogram too. But I don't think it would be simple task to change input to wave file by changing a couple of code lines because (1) wave file can be different in sample rate, mono or stereo, and so on and (2) microphone input signal would be relatively very short but wave file can be huge. Nevertheless, I think it is still great reference for spectrogram in c#. Thanks the author for that.
I think it would be as simple as following.
1. read wave file - read header of the file in riff format and get info about samples. I believe there are several good articles showing a way to handle wave file.
2. pass samples from #1 into Process method in AudioFrame. I think it will additionally require more code changes according to the wave file header info, e.g., mono or stereo, sample rate, etc. Also you might have to change drawing routine as program might need to draw huge data.
|
|
|
|
 |
|
 |
I suggest checking here for posts - as there are few articles covering how does the wav file look like, from that you can easily build the thing you need
|
|
|
|
 |
|
 |
I am getting the spectrogram of wav files using the same classes. Only thing is that I am playing the wav file using DirectSound or SoundPlayer and then collect the audio from lineout using wavout class. It works, but there is a great amount of noise and the frequency domain display stops after about five minutes.
|
|
|
|
 |
|
 |
Hi,
I am doing project in C# . in which I have to draw waveform for existing .wav file and also explain if wave file have 2 channels
and also I have to edit that generated wave
how can i do this anybody can help plz
Thanks,
gauri
|
|
|
|
 |
|
 |
Jeff
Very great application. And thanks for sharing the code.
Here's my one point:
Try right click or left click on the window when it's running, you'll observe drawing delay.
That's because the events raised by the timers are in the same thread of UI.
You can use System.Timers.Timer to eliminate this delay, but graphic object need to be locked to avoid multithread issues.
|
|
|
|
 |
|
 |
Hi!
Lines 67 and 71 in the file AudioFrame.cs are both like this:
if (_waveLeft[h] > AmplitudeThreshold || _waveLeft[h] < -AmplitudeThreshold)
I assume that the line 71 should actually be like this:
if (_waveRight[h] > AmplitudeThreshold || _waveRight[h] < -AmplitudeThreshold)
Anyway, thanks for the useful article!
Atis
P.S. Below is the relevant fragment of the original code:
for (int i = 0; i < wave.Length; i += 4)
{
_waveLeft[h] = (double)BitConverter.ToInt16(wave, i);
if (IsDetectingEvents == true)
if (_waveLeft[h] > AmplitudeThreshold || _waveLeft[h] < -AmplitudeThreshold)
IsEventActive = true;
_waveRight[h] = (double)BitConverter.ToInt16(wave, i + 2);
if (IsDetectingEvents == true)
if (_waveLeft[h] > AmplitudeThreshold || _waveLeft[h] < -AmplitudeThreshold)
IsEventActive = true;
h++;
}
|
|
|
|
 |
|
|
 |
|
|
 |
|
 |
I'm an experienced and published telemarketing expert looking for a programmer as a partner. I'm interested in offering an anger detection service that would enable call centers to identify those calls involving angry customers.
Specifically, I need an application that can perform the following functions rapidly:
(1) automatically open one audio file after another
(2) analyze each file for mean pitch, maximum pitch variation, mean volume, maximum volume variation, and rate of speech
(3) Report the raw data in text format that can be downloaded into a Excel spreadsheet or other database
The programmer would receive 50% of gross revenue.
Are you interested in receiving a business proposal? Do you know someone else who might be?
Thanks you -
Stewart Rogers
Stewart@100000ColdCalls.com
|
|
|
|
 |
|
 |
Refer to www.100000coldcallsscam.com
to learn the facts about
Stewart L. Rogers of Olympia, Wa, formerly of
Raleigh, NC.....
more about this so-called telemarketing expert,
his criminal arrests and civil lawsuits related to
his past telemarketing businesses from unhappy and ripped off
businesses.
No wonder he wants to detect anger first on a cold call...
Stewart Rogers has a lot of people who don't like him or
his business practices!
is this legal? Or an invasion of the privacy of
the person receiving a call?
Beware! you were warned! better to get your money up front, he did not respect written contracts in his past business dealings and has declared bankruptcy numerous times, AND is currently in bankruptcy. Ask the business owners he made deals with in the past, they got paid nothing.
|
|
|
|
 |
|
 |
If i speak some thing the wave are moving but the recorded one is not storing how it will work
Can you please help me on this
Ashok Nalam
|
|
|
|
 |
|
 |
Jeff,
This is a great example program. I would like to incorporate the actual frequencies that are being read along with the graph along the X-Axis.
I see after the fourier transform, your member variables _fftLeft and _fftRight contain 2048 values containing the amplitudes. How can I translate this to the appropriate actual frequencies?
I’m actually interesting in displaying just a few of the frequencies – for instance 2500.
I’m a newbie to DSP side of things, so any help or insight would be appreciated.
Thank you!
|
|
|
|
 |
|
 |
For an FFT it's frequencies are displayed as follows:
For N samples the maximum freq is at N/2 ie if you sample at 44.1kHz the max freq is 22.025kHz at sample number N/2. Each sample has a freq (i/N)*fs where fs is the sampling freq and i is the frequency bin.
So if you have 2048 samples in your FFT then only 1024 can be used and the first frequency bin has a frequency (1/2048)*fs..as do all the rest ie the second one has freq (2/2048)*fs etc
|
|
|
|
 |
|
 |
actually it should read N/2-1 but it makes little difference
|
|
|
|
 |