
Write Your Own Bar Chart Winforms User Control
4.92/5 (11 votes)
An article on how to create a Bar Chart Winforms User control

Introduction
I have some free time between projects recently. I thought of utilizing my time in doing something that is useful in my next project which is going to start soon. When I looked at the requirements, I found that there is a bar chart that has to be displayed in the windows .NET application. I have been looking for some ready made controls on the net and found many controls but none of them are free. There are some good graph controls available for buying and they have a lot of other features which I don't need. I don't need many features in the control, so I thought it is a waste of money to recommend purchase of those controls.
Hence I started building my own simple control. I know this is a very basic control and it might not have all the features someone expects, but it serves my purpose. If anyone is interested, she/he can enhance this control for the features she/he wants. This is not a fully tested control.
For this article, I used VS 2003, SQL Server Database. In this project I used the System.Drawing namespace for displaying the UI.
Database Preparation
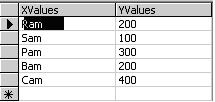
The database for this project contains one table which is used as data source. I named the database as "ChartDB" and table name is "ControlSource" which has two columns "XValues" and "YValues". This database is a test database which is used to show the Bar chart.
The table structure and data are as follows. (Script for generating table is included in Database folder of the source code.)
ControlSource table structure:
Project Structure
Using the Code
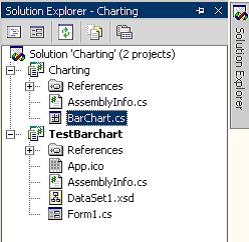
The main project is "Charting" which is a class library type of project. The core of the project is a Windows User control "BarChart.cs" which creates the bar chart. The "TestBarchart" project is the test project which uses the Barchart user control. First let us discuss about User control.
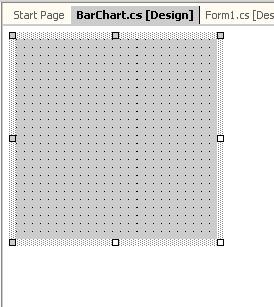
Add a user control to the Charting project:
Then start writing code. The main code snippets are given below:
Declare private variables required:
  #region Private Variables
  int x_margin=20;
  int y_margin=20;
  int x_in_margin=20;
  int y_in_margin=20;
  int font_size;
  double y_scale=1;
  int n_datpoints =4;
  Color primaryLineColor = Color.DeepSkyBlue;
  Color alternateLineColor = Color.Red;
  Color baselineColor = Color.Black;
  Color borderlineColor = Color.Black;
  Color primaryFillColor = Color.DeepSkyBlue;
  Color alternateFillColor = Color.Red;
  Color primaryValueColor = Color.Blue;
  Color alternateValueColor = Color.Red;
  //Databinding-Start
  private DataTable dataSource;
  private string dataMember_Y;
  private string dataMember_X;
  //Databinding-End
  #endregion Private Variables
Add the properties required to the control:
  #region Public Properties

  public int Xmargin
  {
   get { return this.x_margin; }
   set { this.x_margin = value; }
  }

  public int Ymargin
  {
   get { return this.y_margin; }
   set { this.y_margin = value; }
  }

  public int Xinmargin
  {
   get { return this.x_in_margin; }
   set { this.x_in_margin = value; }
  }
  public int Yinmargin
  {
   get { return this.y_in_margin; }
   set { this.y_in_margin = value; }
  }
  public Color PrimaryLineColor
  {
   get { return this.primaryLineColor; }
   set { this.primaryLineColor = value; }
  }
  public Color AlternateLineColor
  {
   get { return this.alternateLineColor; }
   set { this.alternateLineColor = value; }
  }
  public Color BaselineColor
  {
   get { return this.baselineColor; }
   set { this.baselineColor = value; }
  }
  public Color BorderlineColor
  {
   get { return this.borderlineColor; }
   set { this.borderlineColor = value; }
  }
  public Color PrimaryFillColor
  {
   get { return this.primaryFillColor; }
   set { this.primaryFillColor = value; }
  }
  public Color AlternateFillColor
  {
   get { return this.alternateFillColor; }
   set { this.alternateFillColor = value; }
  }
  public Color PrimaryValueColor
  {
   get { return this.primaryValueColor; }
   set { this.primaryValueColor = value; }
  }
  public Color AlternateValueColor
  {
   get { return this.alternateValueColor; }
   set { this.alternateValueColor = value; }
  }
  //Data Binding - Start
  [TypeConverter("System.Windows.Forms.Design.DataSourceConverter,
    System.Design")]
  [Category("Data")]
  [DefaultValue(null)]
  public DataTable DataSource
  {
   get
   {
    return this.dataSource;
   }
   set
   {
    if (this.dataSource != value)
    {
     this.dataSource = value;
    }
   }
  }
  [Category("Data")]
  [Editor("System.Windows.Forms.Design.DataMemberListEditor,System.Design",
     "System.Drawing.Design.UITypeEditor, System.Drawing")]
  [DefaultValue("")]
  public string DataMemberY
  {
   get
   {
    return this.dataMember_Y;
   }
   set
   {
    if (this.dataMember_Y != value)
    {
     this.dataMember_Y = value;
    }
   }
  }
  [Category("Data")]
  [Editor("System.Windows.Forms.Design.DataMemberListEditor,System.Design",
    "System.Drawing.Design.UITypeEditor, System.Drawing")]
  [DefaultValue("")]
  public string DataMemberX
  {
   get
   {
    return this.dataMember_X;
   }
   set
   {
    if (this.dataMember_X != value)
    {
     this.dataMember_X = value;
    }
   }
  }
  //Data Binding - End

#endregion Public Properties
In the above code snippet, the important thing to understand is the data binding. In the properties, we gave datatable type as datasource property. Hence we can assign any datatable as data source for the control. DataMemberX and DataMemberY are string types where we need to give the column names in table (In the test project, they are "XValues" and "YValues").
DrawBarChart Method
  #region DrawBarChart method
  private void DrawBarChart(System.Windows.Forms.PaintEventArgs e)
  {
   try
   {
    // Create a new pen.
    Pen PrimaryColorPen = new Pen(primaryLineColor);
    Pen AlternateColorPen = new Pen(alternateLineColor);
    Pen BaseLinePen = new Pen(baselineColor);
    Pen BorderLinePen = new Pen(borderlineColor);
    // Create new Solid Brush
    SolidBrush PrimarysolidBrush = new SolidBrush(primaryFillColor);
    SolidBrush AlternatesolidBrush = new SolidBrush(alternateFillColor);
    SolidBrush PrimaryValueBrush = new SolidBrush(primaryValueColor);
    SolidBrush AlternateValueBrush = new SolidBrush(alternateValueColor);

    if (dataSource.Rows.Count!=0)
    {
     n_datpoints = dataSource.Rows.Count;}
    float fbar_space = (float)(this.Width - 2* (x_margin+x_in_margin))
    /(2*n_datpoints);
    int bar_space= (int)Math.Round(fbar_space);
    int bar_width = (int)Math.Floor(fbar_space);
    font_size = (int) this.Font.Size;

    //Calculate the scale
    y_scale = (this.Height - 2*(y_margin + y_in_margin))/
    double.Parse(dataSource.Compute("MAX("+dataMember_Y+")","").ToString());
    //Draw border
    e.Graphics.DrawRectangle(BorderLinePen,
     new Rectangle(x_margin,y_margin,this.Width-2*x_margin,this.Height-2*y_margin));
    for (int i=0;i<n_datpoints;i++)
    {
     if (i%2==0)
     {
      e.Graphics.DrawRectangle(PrimaryColorPen,
       new Rectangle(x_margin+x_in_margin+(i+1)*bar_width+i*bar_space,
    this.Height - y_margin - y_in_margin - (int)(Convert.ToInt32
    (dataSource.Rows[i][dataMember_Y].ToString())* y_scale),bar_width,
    (int)(Convert.ToInt32(dataSource.Rows[i][dataMember_Y].ToString())* y_scale)));

      e.Graphics.FillRectangle(PrimarysolidBrush,x_margin+x_in_margin+(i+1)
    *bar_width+i*bar_space,this.Height - y_margin - y_in_margin - (int)
    (Convert.ToInt32(dataSource.Rows[i][dataMember_Y].ToString())* y_scale),
     bar_width,(int)(Convert.ToInt32
	(dataSource.Rows[i][dataMember_Y].ToString())* y_scale));

     using (Font font = new Font
		(this.Font.Name,font_size,this.Font.Style,this.Font.Unit))
      {
       Point point1 = new Point(x_margin+x_in_margin+(i+1)*bar_width+i*
        bar_space-3,this.Height - y_margin - y_in_margin -
        (int)(Convert.ToInt32
	(dataSource.Rows[i][dataMember_Y].ToString())* y_scale)-(int)font.Size-5);
       Point point2 = new Point(x_margin+x_in_margin+(i+1)*bar_width+i*
        bar_space-3,this.Height - y_margin - y_in_margin);
       e.Graphics.DrawString(Convert.ToInt32(dataSource.Rows[i]
        [dataMember_Y].ToString()).ToString(),font, PrimaryValueBrush, point1);
       e.Graphics.DrawString(dataSource.Rows[i][dataMember_X].ToString()
        .Substring(0,(bar_width/font_size)+1),font, PrimaryValueBrush, point2);
      }
     }
     else
     {
      e.Graphics.DrawRectangle(AlternateColorPen,
       new Rectangle(x_margin+x_in_margin+(i+1)*bar_width+i*bar_space,
        this.Height - y_margin - y_in_margin - (int)(Convert.ToInt32
        (dataSource.Rows[i][dataMember_Y].ToString())* y_scale),
        bar_width,(int)
	(Convert.ToInt32(dataSource.Rows[i][dataMember_Y].ToString())* y_scale)));

      e.Graphics.FillRectangle(AlternatesolidBrush,x_margin+x_in_margin+(i+1)*
    bar_width+i*bar_space,this.Height - y_margin - y_in_margin -
    (int)(Convert.ToInt32(dataSource.Rows[i][dataMember_Y].ToString())* y_scale),
    bar_width,(int)
	(Convert.ToInt32(dataSource.Rows[i][dataMember_Y].ToString())* y_scale));

      using (Font font =
	new Font(this.Font.Name,font_size,this.Font.Style,this.Font.Unit))
      {
       Point point1 = new Point(x_margin+x_in_margin+(i+1)*bar_width+i*
    bar_space-3,this.Height - y_margin - y_in_margin -
    (int)(Convert.ToInt32
	(dataSource.Rows[i][dataMember_Y].ToString())* y_scale)-(int)font.Size-5);
       Point point2 = new Point(x_margin+x_in_margin+(i+1)*bar_width+i*
        bar_space-3,this.Height - y_margin - y_in_margin);
       e.Graphics.DrawString(Convert.ToInt32(dataSource.Rows[i]
        [dataMember_Y].ToString()).ToString(),font, AlternateValueBrush, point1);
       e.Graphics.DrawString(dataSource.Rows[i]
        [dataMember_X].ToString().Substring(0,(bar_width/font_size)+1)
        ,font, AlternateValueBrush, point2);
      }
     }
    }
    // Draw Baseline below bars
    e.Graphics.DrawLine(BaseLinePen,x_margin+x_in_margin,this.Height
         - y_margin - y_in_margin,this.Width-x_margin-x_in_margin,
        this.Height - y_margin - y_in_margin);

    // Draw Vertical Line
    e.Graphics.DrawLine(BaseLinePen,x_margin+x_in_margin,
        this.Height - y_margin - y_in_margin,x_margin+x_in_margin,
        y_margin + y_in_margin);
    //Dispose of Pens and Brushes.
    PrimaryColorPen.Dispose();
    AlternateColorPen.Dispose();
    BaseLinePen.Dispose();
    BorderLinePen.Dispose();
    PrimarysolidBrush.Dispose();
    AlternatesolidBrush.Dispose();
    PrimaryValueBrush.Dispose();
    AlternateValueBrush.Dispose();
   }
   catch(Exception ex)
   {
    string str = ex.Message;
   }
  }
  #endregion DrawBarChart method
Call DrawBarChart method in Paint event:
  #region Event Handlers
  private void Barchart_Paint(object sender, System.Windows.Forms.PaintEventArgs e)
  {
   DrawBarChart(e);
  }
  #endregion Event Handlers
How To Use this Control in Test Project
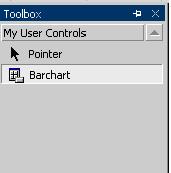
Add Control to Form: Once the Charting project is compiled, add the control to the ToolBox -> My User Controls, using Add / Remove Items option.
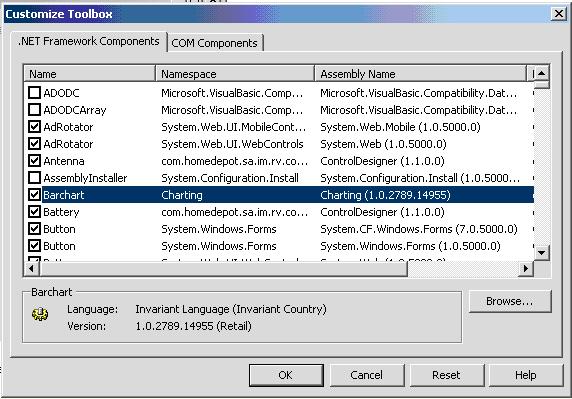
After the User control is added to the toolbox, the toolbox should look like this:
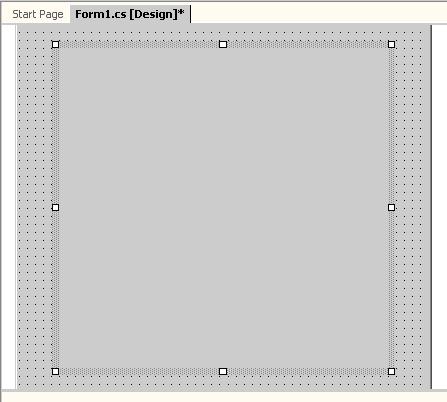
Add a "Windows Application" project to the solution and name it "TestBarchart". Add a Windows Form "Form1" and place the Barchart control on the form from Toolbox.
Setup the DB Server and Connections:
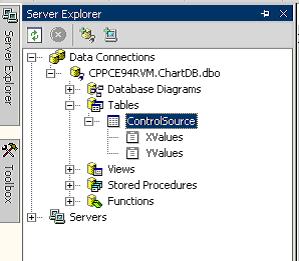
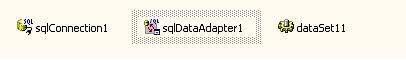
Open the Server Explorer and Add Data connection as shown above. Add DataAdapter to the form by dragging the table on to the form and following the wizard. Generate Dataset and Preview data. Then the data objects should be seen like this:
Set Properties for the control:
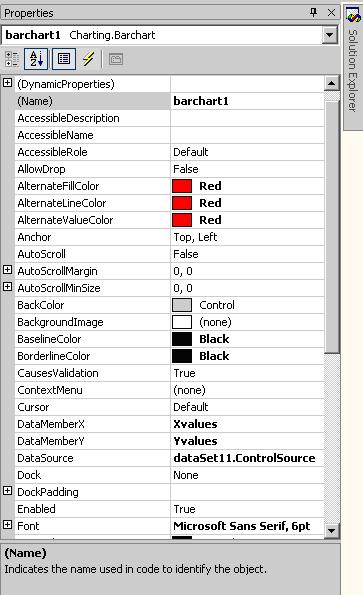
You can change the AlternateFillColor, AlternateLineColor, AlternateValueColor, BaselineColor, BorderLineColor from defaults. Set the Datasource property to dataset11.ControlSource.
Set the DataMemberX to Xvalues and DataMemberY to Yvalues. And run the TestBarchart project.
Points of Interest
There are lots of features that can be added to the control, which I did not touch in this article as I wanted only the minimal features. Many events can be added to the control to allow the control to dynamically refresh whenever there is a change in the datasource.
Comments
Please take the time to vote for this article and/or to comment about it.
History
- 08/22/2007 - Initial version