Introduction
Create an interactive 3D 'spin'able (or 'rotate'able) bar chart in seconds using this WPF3DChart custom control. A few lines of XAML or C# (or any .NET compliant language code) is enough to create an interactive, spinnable 3D bar chart. Also, you can use WPF databinding to have the ‘see the 3D chart change live as you input data’ effect.
What do you want to do today?
- If you want to see a quick demo, follow the easy instructions in the section ‘To see a Demo’.
- If you want to test this
WPF3DChart control in a sample project, follow the instructions in the section ‘How to use the code / Steps to use the assembly’. - If you want to learn how to write such a control, start reading from the section ‘Basics of WPF 3D Geometry’.
To see a demo
- Step 1: Copy the binary zip file (download using the link at the top of this article) to a separate folder.
- Step 2: It is a compressed file. Choose a temporary folder and copy (decompress) all the files into the folder.
- Step 3: Run the Test3DChart.exe file.
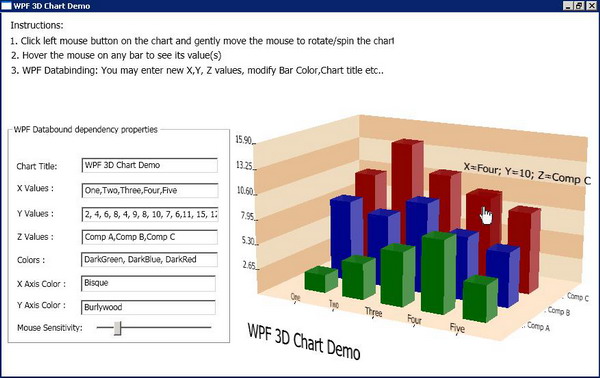
- Step 4: You should see an application as in the image above.
Fun part:
- Left click on the chart and hold your left mouse button. Slowly move the mouse. You can see the chart spinning /rotating.
- Hover the mouse on the bars. You will see the selected bar enhanced and the X,Y,Z values for that bar.
How to use the code / Steps to use the assembly
The steps below may be followed to write a sample application using this WPF based 3D bar chart control:
- Step 1: Create a Windows WPF application using Visual Studio 2008.
- Step 2: Add the assembly as a reference to the project.
- Step 3: In the Toolbox, right click, then select 'Choose Items'. Choose the WPF tab. Then, click the Browse button to choose the assembly. Click the OK button after selecting the assembly.
- Step 4: Now, you will see an entry in the Toolbox with the name 'WPF3DControl'. Drag and drop it to your main window or code in XAML to use the control.
- Step 5: Select the control. Then, right click and select the Properties menu option.
- Step 6: Add/ modify/ delete the X, Y, and Z properties (if required) to match your requirements.
- Step 7: Run your application. You should see the interactive 3D bar chart.
Additional details
- You can use the XAML code below to quickly setup the control and run a test:
<Window x:Class="Test3DChart.Window1"
  xmlns="http://schemas.microsoft.com/winfx/2006/xaml/presentation"
  xmlns:x="http://schemas.microsoft.com/winfx/2006/xaml"
  Title="WPF 3D Chart Demo" Height="594" Width="618"
  xmlns:my="clr-namespace:Wpf3DChartTutorial;assembly=Wpf3DChartTutorial"
  WindowState="Maximized" WindowStartupLocation="Manual"
  ResizeMode="CanResizeWithGrip">
    <Grid Height="563" Name="grid1" Width="602"
          HorizontalAlignment="Left"
          VerticalAlignment="Top" ClipToBounds="True">

      <my:WPF3DChart Margin="0,5,0,136" Name="wPF3DChart1"
         ClipToBounds="True" HorizontalContentAlignment="Stretch"
         VerticalContentAlignment="Stretch" MinWidth="100" />
    </Grid>
</Window>
- How to modify the X, Y, Z values at design time?
There are three ways to do this:
- First option: The first and the simplest is to add the X, Y, and Z values in the XAML file in the Design mode as below. You will notice the
XValuesInput, YValuesInput, and ZValuesInput (in bold) in the XAML file below:
<Window x:Class="Test3DChart.Window1"
    xmlns="http://schemas.microsoft.com/winfx/2006/xaml/presentation"
   xmlns:x="http://schemas.microsoft.com/winfx/2006/xaml"
    Title="WPF 3D Chart Demo" Height="594" Width="618"
    xmlns:my="clr-namespace:Wpf3DChartTutorial;assembly=Wpf3DChartTutorial"
    WindowState="Maximized" WindowStartupLocation="Manual"
    ResizeMode="CanResizeWithGrip">
<Grid Height="563" Name="grid1" Width="602"
    HorizontalAlignment="Left" VerticalAlignment="Top"
    ClipToBounds="True">

<my:WPF3DChart Margin="0,5,0,136" Name="wPF3DChart1"
  ClipToBounds="True" HorizontalContentAlignment="Stretch"
  VerticalContentAlignment="Stretch" MinWidth="100"
      XValuesInput="One,Two,Three,Four,Five"
      YValuesInput="2, 4, 6, 8, 4,9, 8, 10, 7, 6,11,15,12,10, 9"
      ZValuesInput="Comp A,Comp B,Comp C" />
</Grid>
</Window>
- Second option: Drag and drop this 3D chart control from the toolbox window. Right click to select Properties. Find the properties
XValuesInput, YValuesInput, and ZValuesInput in there. Update them to your desired values. - Third option: A third way is to use any .NET compliant language code. Here is a C# sample:
wPF3DChart1.XValuesInput = "One,Two,Three,Four,Five";
wPF3DChart1.YValuesInput = "2, 4, 6, 8, 4,9, 8, 10, 7, 6,11,15,12,10, 9";
wPF3DChart1.ZValuesInput = "Comp A,Comp B,Comp C";
- How to databind a textbox (or any other) control to this WPF 3D chart so that the chart gets updated we enter values in the textbox?
Databinding is very simple as all the properties exposed by the 3D bar chart are dependency properties. As in the below sample code, first declare the Binding class object. Then, attach the source. The last step is to bind using the SetBinding method call on the target class. If you are looking for a detailed sample, download the source code of the Test3DChart project.
Binding XValueBinding = new Binding("Text");
XValueBinding.Source = textBox1;
XValueBinding.Mode = BindingMode.TwoWay;
wPF3DChart1.SetBinding(WPF3DChart.XValuesInputProperty, XValueBinding);
Basics of WPF 3D Geometry
The WPF geometry co-ordinate system divides the screen as in the figure below:

As in the above picture, the positive X starts from the origin point (0,0,0) to X, and positive Y starts from the point (0,0,0) to Y, and positive Z starts from the point (0,0,0) to Z. The converse is true, where the opposite directions are negative X, negative Y, and negative Z, respectively. This understanding is useful to draw our 3D geometry model at a desired location.
To make learning WPF a little more fun, consider you are directing a film. Imagine what all basic things you will require: camera, lighting, costumes, and actor(s). The same applies here – you will need camera, lights, brushes, and 3D geometry models (i.e., actors). WPF provides you with different types of lights, allows you to choose your camera position (as you are the director!), gives different kinds of brushes, and provides a library to draw 3D geometry.
Understanding how to draw 3D geometry (the actor) is important. The basic model you can draw is a triangle. This is because triangle is the simplest possible plane. To draw a triangle, you need to plot 3 points in the co-ordinate system. These are called triangle positions. Then, you have to add a normal. A normal is a vector perpendicular to the triangle. It is not difficult to calculate the normal given the 3 vertex positions of a triangle. I have provided the method CalculateNormal in this project that will calculate the normal given the 3 vertex points of a triangle. With this information, you can create a WPF MeshGeometry3D object. Then, all you have to do is create the appropriate brush to paint the MeshGeometry3D. You may refer to the DrawRect method source code below to understand drawing a rectangle (combining two triangles).
Next, all you have to do is add a camera and lights to the scene.
After drawing all your geometry, you need to add the geometry (or geometry group) into the ModelVisual3D object. ViewPort3D is the class object that will contain all the drawings. Hence, the ModelVisual3D object needs to be added to the ViewPort3D object. Then, this can be added to a Grid or a Window based on your needs. You may consider looking at the Initialize method source code given below as a sample.
Description of the control code
There are two classes in this solution. They are WPF3DChart and HitDetails.
HitDetails is a small class that has a Dictionary. The Dictionary stores the geometry and (x,y,z) co-ordinates to provide the Hit Text when the user hovers the mouse over the bar.
WPF3DChart is the class that renders the control. I will walk through the important methods in the WPF3DChar class.
Property XValuesInput: This is a WPF Dependency Property that receives the X values of the 3D bar chart. To implement a Dependency Property, the class needs to derive from DependencyObject. Since this is a custom control, this class already does. The property needs to be registered as a Dependency Property as in the first line. We need to define the setters and getters as usual for this property, with one difference. Instead of setting the values to a class private variable, here we need to call the base class methods GetValue/SetValue. That's all. Everything else is taken care of by the framework.
public static DependencyProperty XValuesInputProperty =
    DependencyProperty.Register("XValuesInput",
                                typeof(string),
                                typeof(WPF3DChart),
                                new FrameworkPropertyMetadata( "",
                                FrameworkPropertyMetadataOptions.AffectsMeasure,
                                new PropertyChangedCallback(OnXValueChanged)));

public string XValuesInput
{
    get
    {
        return (string)this.GetValue(XValuesInputProperty);
    }

    set
    {
        this.SetValue(XValuesInputProperty, value);
    }
}
Method DrawRect: As the name suggests, this method draws a rectangle in a 3D space. To draw a rectangle, we need to draw two adjacent triangles. We need to use the MeshGeometry3D class provided by WPF for this purpose. To draw a rectangle, we need to add Positions, TriangleIndices, Normals, and a Brush. Opacity is a parameter whose value can range from 0.0 to 1.0. This opacity parameter determines how transparent your drawing will be. Once we add all of the above to a GeometryModel3D, we are ready with a drawing. You may wonder why we need four triangles instead of two to draw a rectangle. WPF needs you to specify both the sides of the rectangle. Otherwise, the other side will not be visible while rotating/spinning the drawing.
private GeometryModel3D DrawRect(Point3D P0, Point3D P1, Point3D P2, Point3D P3,
Color BarColor, double OpacityIndex)
{
MeshGeometry3D side0Plane = new MeshGeometry3D();
side0Plane.Positions.Add(P0);
side0Plane.Positions.Add(P1);
side0Plane.Positions.Add(P2);
side0Plane.Positions.Add(P3);
side0Plane.TriangleIndices.Add(0);
side0Plane.TriangleIndices.Add(1);
side0Plane.TriangleIndices.Add(2);
side0Plane.TriangleIndices.Add(2);
side0Plane.TriangleIndices.Add(1);
side0Plane.TriangleIndices.Add(0);
side0Plane.TriangleIndices.Add(0);
side0Plane.TriangleIndices.Add(2);
side0Plane.TriangleIndices.Add(3);
side0Plane.TriangleIndices.Add(3);
side0Plane.TriangleIndices.Add(2);
side0Plane.TriangleIndices.Add(0);
Vector3D normal = CalculateNormal(P2, P1, P0);
side0Plane.Normals.Add(normal);
side0Plane.Normals.Add(normal);
side0Plane.Normals.Add(normal);
normal = CalculateNormal(P0, P1, P2);
side0Plane.Normals.Add(normal);
side0Plane.Normals.Add(normal);
side0Plane.Normals.Add(normal);
normal = CalculateNormal(P3, P2, P0);
side0Plane.Normals.Add(normal);
side0Plane.Normals.Add(normal);
side0Plane.Normals.Add(normal);
normal = CalculateNormal(P0, P2, P3);
side0Plane.Normals.Add(normal);
side0Plane.Normals.Add(normal);
side0Plane.Normals.Add(normal);
MaterialGroup plane0MatGroup = new MaterialGroup();
SolidColorBrush plane0Brush = new SolidColorBrush(BarColor);
plane0Brush.Opacity = DEFAULT_BRUSH_OPACITY;
plane0Brush.Opacity = OpacityIndex;
DiffuseMaterial plane0Material = new DiffuseMaterial(plane0Brush);
plane0MatGroup.Children.Add(plane0Material);
GeometryModel3D plane0Geometry =
new GeometryModel3D(side0Plane, plane0MatGroup);
return plane0Geometry;
}
Method Draw3DBar: This is the method that draws the bars. This method uses a DrawRect to accomplish this. This method calculates the 3D bar co-ordinates. Then, it calls DrawRect to draw its drawings. One more important thing this method does is it populates the Dictionary with the bar geometry and the (x,y,z) values. I will explain its usage in the OnRightMouseClick event handler.
private List<ModelVisual3D> Draw3DBar( string XItem,
string YItem, string ZItem, Point3D PointToStart,
double Height, double Width, Color BarColor)
{
modelArray = new List<ModelVisual3D>();
Point3D P0 = new Point3D(PointToStart.X, PointToStart.Y, PointToStart.Z);
Point3D P1 = new Point3D(PointToStart.X + Width,
PointToStart.Y, PointToStart.Z);
Point3D P2 = new Point3D(PointToStart.X + Width,
PointToStart.Y, PointToStart.Z - Width);
Point3D P3 = new Point3D(PointToStart.X, PointToStart.Y, PointToStart.Z - Width);
Point3D P4 = new Point3D(PointToStart.X, PointToStart.Y + Height, PointToStart.Z);
Point3D P5 = new Point3D(PointToStart.X + Width,
PointToStart.Y + Height, PointToStart.Z);
Point3D P6 = new Point3D(PointToStart.X + Width,
PointToStart.Y + Height, PointToStart.Z - Width);
Point3D P7 = new Point3D(PointToStart.X, PointToStart.Y + Height,
PointToStart.Z - Width);
ModelVisual3D myModelVisual = new ModelVisual3D();
Model3DGroup myModelGroup = new Model3DGroup();
Point3D P00 = new Point3D(xStartingPoint, P4.Y + 0.3, P4.Z - Width / 2.0);
Point3D P11 = new Point3D(P4.X, P4.Y + 0.3, P4.Z - Width / 2.0);
Point3D P22 = new Point3D(P4.X, P4.Y, P4.Z - Width / 2.0 - 0.3);
Point3D P33 = new Point3D(xStartingPoint, P4.Y, P4.Z - Width / 2.0 - 0.3);
Point3D PtToWrite = new Point3D(P4.X, P4.Y + LITTLE_ABOVE,
P4.Z - Width / 2.0 - 0.3);
HitDetails newHitDetails = new HitDetails(XItem, YItem,
ZItem, P00, P11, P22, P33,
PtToWrite, PointToStart, Width, Height, BarColor);
GeometryModel3D rectVisual = DrawRect(P0, P1, P5, P4,
BarColor, DEFAULT_BRUSH_OPACITY);
listOfHitPoints.Add(rectVisual, newHitDetails);
myModelGroup.Children.Add(rectVisual);
Color LightColor = BarColor;
LightColor.A -= DROP_COLOR_BRIGHTNESS;
rectVisual = DrawRect(P1, P2, P6, P5, LightColor, DEFAULT_BAR_OPACITY);
listOfHitPoints.Add(rectVisual, newHitDetails);
myModelGroup.Children.Add(rectVisual);
rectVisual = DrawRect(P3, P2, P6, P7, BarColor, DEFAULT_BAR_OPACITY);
listOfHitPoints.Add(rectVisual, newHitDetails);
myModelGroup.Children.Add(rectVisual);
rectVisual = DrawRect(P0, P3, P7, P4, LightColor, DEFAULT_BAR_OPACITY);
listOfHitPoints.Add(rectVisual, newHitDetails);
myModelGroup.Children.Add(rectVisual);
LightColor.A -= DROP_MORE_COLOR_BRIGHTNESS;
rectVisual = DrawRect(P4, P5, P6, P7, LightColor, DEFAULT_BRUSH_OPACITY);
listOfHitPoints.Add(rectVisual, newHitDetails);
myModelGroup.Children.Add(rectVisual);
rectVisual = DrawRect(P0, P1, P2, P3, BarColor, DEFAULT_BRUSH_OPACITY);
listOfHitPoints.Add(rectVisual, newHitDetails);
myModelGroup.Children.Add(rectVisual);
myModelVisual.Content = myModelGroup;
modelArray.Add(myModelVisual);
return modelArray;
}
Method DrawXYZWithMarkings: This method draws the X plane, Y plane, and the Z plane. This method calculates the length and width planes. It draws the X, Y, and Z planes based on these calculations. The three for loops are used to draw the markings on the planes. These markings are used to specify values in the X, Y, and Z planes.
private List<ModelVisual3D> DrawXYZWithMarkings( string[] XItems,
int NumberOfXItems, double YIncrement,
int NumberOfYItems, string[] ZItems, int NumberOfZItems,
double BarWidth, Color PlaneXColor, Color PlaneYColor,
Color XMarkingColor, Color YMarkingColor, Color ZMarkingColor)
{
List<ModelVisual3D> listXYZ = new List<ModelVisual3D>();
Model3DGroup myModelGroup = new Model3DGroup();
ModelVisual3D myModelVisual = new ModelVisual3D();
myModelVisual.Content = myModelGroup;
listXYZ.Add(myModelVisual);
NumberOfXItems++;
NumberOfYItems++;
NumberOfZItems++;
xInGraph.Clear();
zInGraph.Clear();
yInGraph = 0;
double Width = chartSize.Width / 10.0;
double Height = chartSize.Height / 10.0;
double StartX = -1.0 * Width / 2.0 + 0.5;
double StartY = -1.0 * Height / 2.0 + 0.5;
double EndX = Width / 2.0;
double EndY = -1.0 * Height / 2.0;
double EndYY = Height / 2.0;
xStartingPoint = StartX;
double OneUnitX = (Width - 0.5) / NumberOfXItems;
double OneUnitY = (Height - 0.5) / NumberOfYItems;
double OneUnitZ = BarWidth * SPACE_BETWEEN_BARS;
double ZEnd = (BarWidth * NumberOfZItems *
(Z_ADJUST) * (SPACE_BETWEEN_BARS));
centreX = Width / 2.0;
centreY = Height / 2.0;
centreZ = ZEnd / 2.0;
Point3D PXpoint0 = new Point3D(StartX, StartY, 0);
Point3D PXpoint1 = new Point3D(EndX, StartY, 0);
Point3D PXpoint2 = new Point3D(EndX, StartY, ZEnd);
Point3D PXpoint3 = new Point3D(StartX, StartY, ZEnd);
GeometryModel3D planeX = DrawRect(PXpoint3, PXpoint0,
PXpoint1, PXpoint2, PlaneXColor, 0.9);
Point3D PYpoint0 = new Point3D(StartX, StartY, 0);
Point3D PYpoint1 = new Point3D(StartX, StartY, ZEnd);
Point3D PYpoint2 = new Point3D(StartX, EndYY, ZEnd);
Point3D PYpoint3 = new Point3D(StartX, EndYY, 0);
GeometryModel3D planeY = DrawRect(PYpoint0, PYpoint1,
PYpoint2, PYpoint3, PlaneYColor, 0.9);
myModelGroup.Children.Add(planeX);
myModelGroup.Children.Add(planeY);
double MarkingWidth = 0.07;
double MarkingHeight = 0.5;
double OneLetterWidth = 0.8;
double OneLetterHeight = 1.6;
double StartXPosition = StartX + OneUnitX;
yInGraph = StartY;
for (int Counter = 0; Counter < NumberOfXItems - 1; Counter++)
{
xInGraph.Add(StartXPosition);
Point3D pMarkX0 = new Point3D(StartXPosition - MarkingWidth,
EndY + MarkingHeight, 0 - MarkingHeight);
Point3D pMarkX1 = new Point3D(StartXPosition + MarkingWidth,
EndY + MarkingHeight, 0 - MarkingHeight);
Point3D PMarkX2 = new Point3D(StartXPosition + MarkingWidth, EndY, 0);
Point3D pMarkX3 = new Point3D(StartXPosition - MarkingWidth, EndY, 0);
Point3D pToWrite = new Point3D(StartXPosition -
(XItems[Counter].Length * OneLetterWidth / 2.0),
EndY + MarkingHeight, 0 - MarkingHeight);
GeometryModel3D planeToMark = DrawRect(pMarkX0, pMarkX1,
PMarkX2, pMarkX3, XMarkingColor, 0.985);
myModelGroup.Children.Add(planeToMark);
double LetterLength = XItems[Counter].Length * OneLetterWidth;
planeToMark = WriteText(pToWrite, LetterLength,
OneLetterHeight, XItems[Counter]);
myModelGroup.Children.Add(planeToMark);
StartXPosition += OneUnitX;
}
double StartYPosition = StartY + OneUnitY;
double StartYItem = YIncrement;
for (int Counter = 0; Counter < NumberOfYItems - 1; Counter++)
{
Point3D pMarkY0 = new Point3D(StartX - MarkingHeight / 2.0,
StartYPosition - MarkingWidth, 0);
Point3D pMarkY1 = new Point3D(StartX - MarkingHeight / 2.0,
StartYPosition + MarkingWidth, 0);
Point3D PMarkY2 = new Point3D(StartX + MarkingHeight / 2.0,
StartYPosition + MarkingWidth,
0 - MarkingHeight);
Point3D pMarkY3 = new Point3D(StartX + MarkingHeight / 2.0,
StartYPosition - MarkingWidth,
0 - MarkingHeight);
GeometryModel3D planeToMark = DrawRect(pMarkY0, pMarkY1,
PMarkY2, pMarkY3, YMarkingColor, 0.985);
myModelGroup.Children.Add(planeToMark);
StringBuilder YItemToWrite = new StringBuilder();
YItemToWrite.AppendFormat("{0,2:f}", StartYItem);
double LetterLength = YItemToWrite.Length * OneLetterWidth;
Point3D pToWrite = new Point3D(StartX - MarkingHeight / 2.0 - LetterLength,
StartYPosition - MarkingWidth, 0);
planeToMark = WriteText(pToWrite, LetterLength,
OneLetterHeight, YItemToWrite.ToString());
myModelGroup.Children.Add(planeToMark);
StartYPosition += OneUnitY;
StartYItem += YIncrement;
}
double StartZPosition = 0 - OneUnitZ;
for (int Counter = 0; Counter < NumberOfZItems - 1; Counter++)
{
zInGraph.Add(StartZPosition);
Point3D pMarkX0 = new Point3D(EndX - MarkingHeight / 2.0, EndY,
StartZPosition + MarkingWidth);
Point3D pMarkX1 = new Point3D(EndX + MarkingHeight / 2.0,
EndY + MarkingHeight / 2.0,
StartZPosition + MarkingWidth);
Point3D PMarkX2 = new Point3D(EndX + MarkingHeight / 2.0,
EndY + MarkingHeight / 2.0,
StartZPosition - MarkingWidth);
Point3D pMarkX3 = new Point3D(EndX - MarkingHeight / 2.0, EndY,
StartZPosition - MarkingWidth);
Point3D pToWrite = new Point3D(EndX - MarkingHeight / 2.0 + 1.0,
EndY, StartZPosition + MarkingWidth);
GeometryModel3D planeToMark = DrawRect(pMarkX0, pMarkX1,
PMarkX2, pMarkX3, XMarkingColor, 0.985);
myModelGroup.Children.Add(planeToMark);
double LetterLength = ZItems[Counter].Length * OneLetterWidth;
planeToMark = WriteText(pToWrite, LetterLength,
OneLetterHeight, ZItems[Counter]);
myModelGroup.Children.Add(planeToMark);
StartZPosition -= OneUnitZ;
}
GeometryModel3D titleToDisplay = WriteText(new Point3D((chartSize.Width / -20.0),
(chartSize.Height / -20.0) - 7.0, 2.5),
OneLetterWidth * 2.0 * ChartTitle.Length,
OneLetterHeight * 2.0, ChartTitle);
myModelGroup.Children.Add(titleToDisplay);
return listXYZ;
}
Method Draw3DChart: This method is the main method called by Initialize. This method gets input the X, Y, and Z values. Then, this method draws the bars calling the Draw3DBar method. Finally, this method calls DrawXYZWithMarkings to draw the X, Y, and Z planes.
#region "This method is the main method that draws the 3D bar chart "
private List<ModelVisual3D> Draw3DChart(string[] XItems, double[] YItems,
string[] ZItems, Color xStartingPointColor, Color YPlaneColor,
Color[] ZPlaneColor, double BarWidth)
{
List<ModelVisual3D> modelsToAdd = new List<ModelVisual3D>();
if (XItems.Length * ZItems.Length != YItems.Length ||
ZPlaneColor.Length <= ZItems.Length)
{
}
if (YItems.Length > 0 && XItems.Length > 0 && ZItems.Length > 0)
{
double MaxY = YItems[0];
for (int Counter = 1; Counter < YItems.Length; Counter++)
{
if (MaxY < YItems[Counter])
{
MaxY = YItems[Counter];
}
}
double Ht = chartSize.Height / 30.0;
double OneYUnit = ((chartSize.Height / 10.0)) / MaxY;
ComputeXZInGraph(XItems.Length, YItems.Length, BarWidth);
OneYUnit = ((chartSize.Height / 10.0) - (chartSize.Height / (10 * Ht))) / MaxY;
int CounterY = 0;
for (int CounterZ = 0; CounterZ < ZItems.Length; CounterZ++)
{
for (int CounterX = 0; CounterX < XItems.Length; CounterX++)
{
List<ModelVisual3D> modelBars =
Draw3DBar(XItems[CounterX], YItems[CounterY].ToString(),
ZItems[CounterZ],
new Point3D(xInGraph[CounterX] - BarWidth / 2.0,
yInGraph,
zInGraph[CounterZ] + BarWidth / 2.0),
OneYUnit * YItems[CounterY], BarWidth,
ZPlaneColor[CounterZ]);
List<ModelVisual3D>.Enumerator enumModels =
modelBars.GetEnumerator();
while (enumModels.MoveNext())
{
modelsToAdd.Add(enumModels.Current);
}
CounterY++;
}
}
Ht = chartSize.Height / 30.0;
OneYUnit = ((chartSize.Height / 10.0)) / MaxY;
List<ModelVisual3D> modelBars1 = DrawXYZWithMarkings(XItems,
XItems.Length, MaxY / (Ht - 1),
(int)Ht, ZItems, ZItems.Length,
BarWidth, XAxisColorItem,
YAxisColorItem,
Colors.Black,
Colors.Black,
Colors.Black);
List<ModelVisual3D>.Enumerator enumModels1 = modelBars1.GetEnumerator();
while (enumModels1.MoveNext())
{
modelsToAdd.Add(enumModels1.Current);
}
}
return modelsToAdd;
}
Method Initialize: This method is the first method called by the OnInitialized base class override. This method sets all the default values for a first time look of the 3D chart.
private void Initialize()
{
if (chartSize.Height == 0 || chartSize.Width == 0) return;
Initializing = true;
zCameraDistance = 175 + 5 * ZItems.Length;
mainViewPort.Children.Clear();
mainViewPort.Children.Add(lightModelVisual);
listOfHitPoints.Clear();
this.InvalidateVisual();
List<ModelVisual3D> retValue;
List<ModelVisual3D>.Enumerator enumList;
SelectedHit = null;
modelForHitText = new ModelVisual3D();
OneLetterWidthForHitText = 1.1;
OneLetterHeightForHitText = 1.7;
PointToWrite0 = new Point3D();
PointToWrite1 = new Point3D();
PointToWrite2 = new Point3D();
PointToWrite3 = new Point3D();
yPlane2DPoint0 = new Point(0, 1);
yPlane2DPoint1 = new Point(1, 1);
yPlane2DPoint2 = new Point(1, 0);
yPlane2DPoint3 = new Point(0, 0);
retValue = Draw3DChart(XItems, YItems, ZItems, Colors.Yellow,
Colors.Cyan, ZPlaneColors,
chartSize.Width/(XItems.Length * 2.2 * 10));
enumList = retValue.GetEnumerator();
while (enumList.MoveNext())
{
mainViewPort.Children.Add(enumList.Current);
}
retValue.Clear();
ComputeCameraPosition();
Initializing = false;
this.InvalidateVisual();
}
Mouse move and left button down handlers: This is an important handler that is responsible for the rotation of the 3D geometry. This method calculates the move, i.e., how far the mouse moved with respect to the Y or X axis, while pressing the left button. Then, it calls ComputeCameraPosition to calculate the position in the Sphere. Well, to explain in a little detail: initially, our work is to just draw the geometry, light up the scene, and then place the camera. These three basic steps are required by WPF to show us a 3D picture on the screen. After doing this, if we want to spin/rotate the geometry, all we have to do is move the camera. Imagine placing all these geometry on a dining table in your home. Then, imagine viewing it in a camcorder display moving on a spherical plane.
I simply used the standard 8th grade math geometry formula ‘Any point on sphere’ to calculate the camera position:
private void OnMouseMove(object sender, MouseEventArgs me)
{
if (me.LeftButton == MouseButtonState.Pressed && leftButtonDown == true)
{
Point retPoint = me.GetPosition(pThis);
double MouseX = retPoint.X;
double MouseY = retPoint.Y;
if (MouseX == MouseXFirstDown && MouseY == MouseYFirstDown)
{
return;
}
if (MouseXFirstDown != MouseX)
{
XAngle += (MouseX - MouseXFirstDown) / 2;
MouseXFirstDown = MouseX;
}
if (MouseYFirstDown != MouseY)
{
YAngle += (MouseY - MouseYFirstDown) / 2;
MouseYFirstDown = MouseY;
}
ComputeCameraPosition();
this.InvalidateVisual();
}
Point pt = me.GetPosition((UIElement)sender);
HitTestResult result = VisualTreeHelper.HitTest(mainGrid, pt);
if (result != null)
{
RayHitTestResult res = result as RayHitTestResult;
if (res != null)
{
GeometryModel3D geoMod = res.ModelHit as GeometryModel3D;
HitDetails myHitDetails;
if (listOfHitPoints.TryGetValue(geoMod, out myHitDetails))
{
SelectedHit = myHitDetails;
this.InvalidateVisual();
return;
}
}
}
SelectedHit = null;
this.InvalidateVisual();
}
private void OnMouseDown(object sender, MouseEventArgs e)
{
if (e.LeftButton == MouseButtonState.Pressed)
{
leftButtonDown = true;
Point retPoint = e.GetPosition(pThis);
MouseXFirstDown = retPoint.X;
MouseYFirstDown = retPoint.Y;
}
else
{
leftButtonDown = false;
}
}
private void MouseLeftButtonUpEventHandler(object sender, MouseEventArgs e)
{
leftButtonDown = false;
}
Method OnRender: Last but not least, OnRender just modifies the camera position. It draws the HitPoint if the user right clicks on a displayed bar.
protected override void OnRender(DrawingContext drawingContext)
{
if (!Initializing)
{
persptCamera.LookDirection = cameraLookDirection;
persptCamera.Position = cameraPosition;
if (null != SelectedHit && (PrevSelectedHit == null ||
0 != PrevSelectedHit.StringToDisplay.CompareTo(SelectedHit.StringToDisplay)))
{
if (geometryForHitText != null)
{
geometryForHitText = null;
modelForHitText.Content = null;
mainViewPort.Children.Remove(modelForHitText);
}
if (modelsForHitTest != null)
{
List<ModelVisual3D>.Enumerator enumModelsI =
modelsForHitTest.GetEnumerator();
while (enumModelsI.MoveNext())
{
mainViewPort.Children.Remove(enumModelsI.Current);
}
}
LetterLengthForHitText =
SelectedHit.StringToDisplay.Length * OneLetterWidthForHitText;
Point3D ptToWRite = SelectedHit.P2;
ptToWRite.Y += LITTLE_ABOVE;
geometryForHitText = WriteText(SelectedHit.PointToWrite,
LetterLengthForHitText,
OneLetterHeightForHitText,
SelectedHit.StringToDisplay);
modelsForHitTest = Draw3DBar(SelectedHit.XItem,
SelectedHit.YItem,
SelectedHit.ZItem,
SelectedHit.PointToStart,
SelectedHit.Height,
SelectedHit.Width ,
SelectedHit.BarColor);
List<ModelVisual3D>.Enumerator enumModels =
modelsForHitTest.GetEnumerator();
while (enumModels.MoveNext())
{
mainViewPort.Children.Add(enumModels.Current);
}
PrevSelectedHit = SelectedHit;
modelForHitText.Content = geometryForHitText;
mainViewPort.Children.Add(modelForHitText);
}
else if (null == SelectedHit)
{
geometryForHitText = null;
modelForHitText.Content = null;
mainViewPort.Children.Remove(modelForHitText);
if (modelsForHitTest != null)
{
List<ModelVisual3D>.Enumerator enumModels =
modelsForHitTest.GetEnumerator();
while (enumModels.MoveNext())
{
mainViewPort.Children.Remove(enumModels.Current);
}
}
}
}
base.OnRender(drawingContext);
}
I think this control code gives some insight into 3D geometry drawing in WPF custom controls.
Your Feedback?
Feedback is a great mechanism to improve. Your feedback messages will help the community to have a better article and help foster improvement. So, let me know your feedback.
History
- 7 Sep. 2008 -- Initial version.
- 8 Sep. 2008 -- Uploaded the correct right version of the source. Added a section explaining the basics.
- 14 Sep. 2008 -- Updated the Test Sample application to allow user inputs such as X,Y,Z values and the chart title.
- 19 Sep. 2008 -- Modified all the properties in the custom control to be WPF Dependency Properties. Also updated the test app to bind to the Dependency Properties. Now, as the user enters values, the chart changes dynamically.
- 21 Sep. 2008 -- Modified the 3D bar interactivity based on the mouse move, bar resized to fit the screen, fixed a few bugs, and added source code comments.
- 28 Sep. 2008 - Added multi-color Y axis, mouse cursor changes, and mouse sensitivity.
- 17 Mar. 2009 - Added support to display the chart in any window other than the main window.
This member has not yet provided a Biography. Assume it's interesting and varied, and probably something to do with programming.


 General
  News
News  Suggestion
  Question
  Bug
Bug  Answer
  Joke
Joke  Praise
  Rant
Rant  Admin
Admin 


