
Remote Debugging on IIS
4.67/5 (2 votes)
Introduction
This article helps you to learn how to debug the website deployed on IIS on remote machine using visual studioBackground
There are some situations,when there is a need for finding the cause of any error occuring due to some environmental factors like OS settings,directory settings, Web Server settings etc. in a site deployed on IIS on remote machine.Steps Involved
Settings to be Done on Remote Machine
- Allowing IIS process to be accessed from remote machine
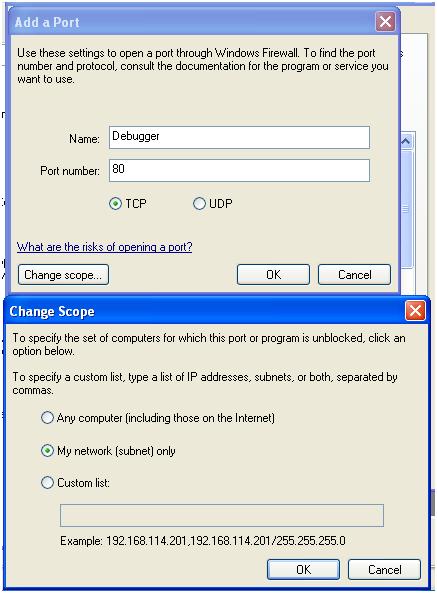
- Click on Exceptions, under Exceptions click "Add Port Tab".
- Under "AddPort" Tab, provide a friendly Name, Port of IIS (i.e 80 default)and select TCP.
- Under "AddPort Tab", Click on Change Scope Tab, select My Network (subnet only),then click OK twice.
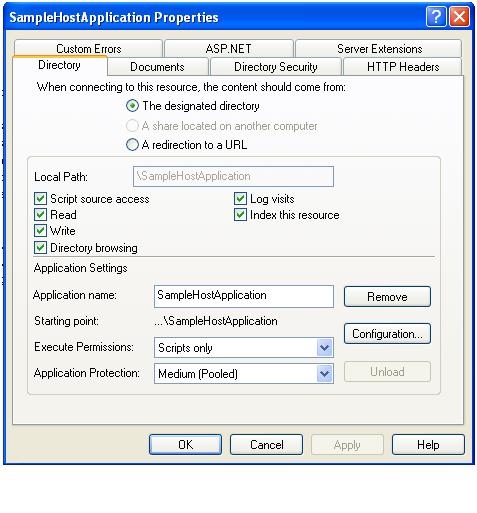
- Setting to be done on IIS
- Right Click particular WebSite (e.g SampleHostApplication),Click "properties".
- Then click "Directory security" and then click "Edit" Tab. Make sure "Anonymous Authentication" and "Integrated Windows Authentication" checkbox is checked.
Go to Start'Control Panel'Windows Firewall (path may vary according to OS).
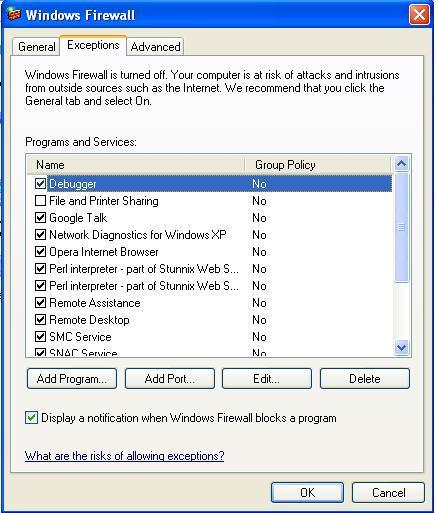
Firewall settings are done.
Go to IIS:
Check all check boxes. As shown in Fig below:
Click on OK twice.
As shown in Fig below.

IS settings are done.
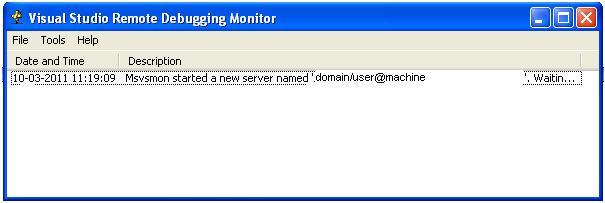
- Setting Remote Debugger Monitor
- Go to path "C:\Program Files\Microsoft Visual Studio 9.0\Common7\IDE\Remote Debugger\x86" or
"C:\Program Files\Microsoft Visual Studio 9.0\Common7\IDE\Remote Debugger\x86 ", depending on the installation. - Double Click "msvsmon.exe", below is the similar display.
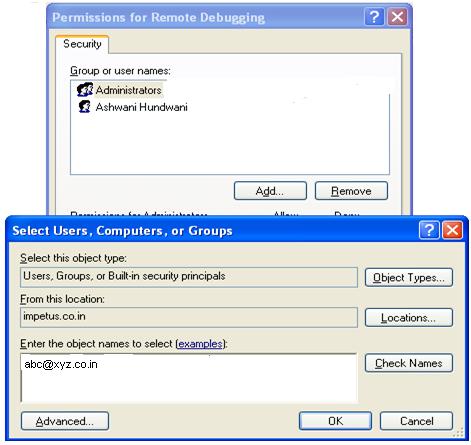
- Click on "Tools"'"Permissions", then click "Add" Tab
- Enter name of the user who wants to debug the IIS. Click OK twice .Check name,user should be on the same subnet.
- Website Settings
Remote Debugger Settings are done.
Go to web.config file of the site and add the compilation Tag mentioned below.
 <system.web;>
      <compilation debug="true" />
</system.web >
NOTE:
As we want to debug the application on IIS we have to enable it for debugging.
Some more settings are required to be done on Remote machine, but we will discuss them in conjunction with settings to be done on developer machine.
We are done with the settings on the remote machine. Now any website running under IIS on Remote machine can be debugged by the user who is given the permissions.
Setting to be Done on Development Machine
In development environment, we will debug website using Visual Studio. We must have the same codebase for the website as deployed on IIS.Some Key Points
- The version of Remote Debug monitor on remote machine should be compatible with the IDE you are using to debug the application.
- Timestamps of ".dll" files should be same as the ".dll" files in the websites running under IIS on tremote machine.
- "Rebuild" the entire site in visual studio in "debug" mode.
- Copy all ".dll" and ".pdb" files from bin folder of the website and paste them in bin folder of the website on IIS on remote machine.
WHY PDB files?
PDB stands for (program debug database),it contains the symbols for the managed code. These symbols allow developer to debug the code using "breakpoints" in visual studio. It is necessary to place ".pdb" files in bin directory of IIS in order to debug the code running under IIS.Configuring Visual Studio for Remote Debugging
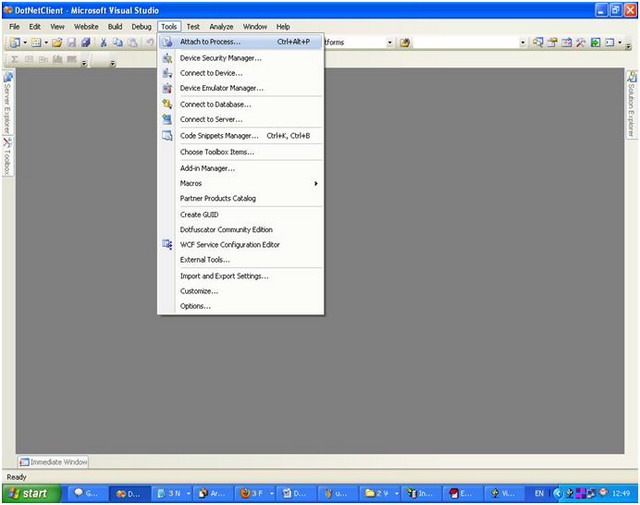
Open website in visual studio, then perform following steps:- Click on "Tools"'"Attach to process " as shown below:
- In "Attach to process",enter the "domain name","username" and "machine name" of the user of that remote machine in the format shown below in the Qualifier name
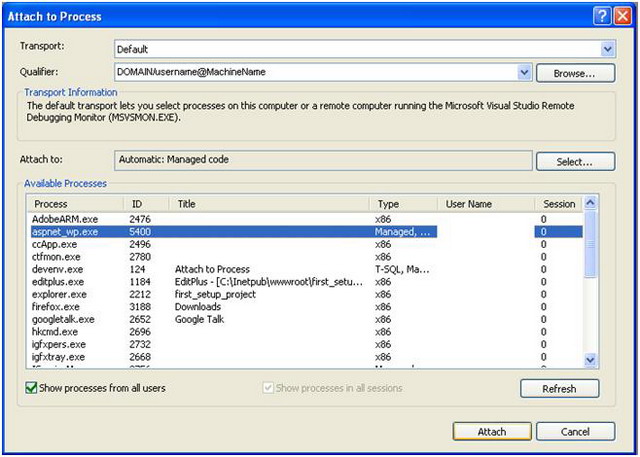
Make sure that:
- In Transport "Default " is selected.
- In Attach to: "Automatic:Managed Code" is selected.
- Show process from all users is checked.
Note:
If it does not appears in the list of processes remote machine ,type the url of the website in your browser e.g "http://machine name:port/website name/page.aspx" and press enter.IIS process will be launched on remote machine. Click on refresh button shown above you can see the process in the list.
Select the process and Click "Attach".
Now, Visual Studio will initiate the debugger , place breakpoint in your project, wherever you want to debug the code. If the control goes through that particular flow, your debugger will stop on that statement. As shown below:

Now,you can easily debug any website running on IIS on the remote location through your own development enviroment.